Chapter 1. Impact 8.3
Impact …ON MEDICINE: I8.3 Molecular recognition and drug design
The binding of a ligand, or guest, to a biopolymer, or host, is governed by molecular interactions. To devise efficient therapies, it is important to know how to characterize and optimize molecular interactions between the host and the guest. Examples of biological host–guest complexes include enzyme–substrate complexes, antigen–antibody complexes, and drug–receptor complexes. In all these cases, a site on the guest contains functional groups that can interact with complementary functional groups of the host. For example, for tight binding to occur, a hydrogen-bond donor group of the guest must be positioned near a hydrogen-bond acceptor group of the host. Typically, many specific intermolecular contacts must be made in a biological host–guest complex and, as a result, a guest binds only hosts that are chemically similar. The strict rules governing molecular recognition of a guest by a host control every biological process, from metabolism to immunological response, and provide important clues for the design of effective drugs for the treatment of disease.
Interactions between nonpolar groups can be important in the binding of a guest to a host. For example, many enzyme active sites have hydrophobic pockets that bind nonpolar groups of a substrate. In addition to dispersion, repulsive, and hydrophobic interactions, π-stacking interactions are also possible, in which the planar π systems of aromatic macrocycles lie one on top of the other, in a nearly parallel orientation. Such interactions are responsible for the stacking of hydrogen-bonded base pairs in DNA (Fig. 1). Some drugs with planar π systems (such as the molecule in Fig. 1) are effective because they intercalate between base pairs through π-stacking interactions, causing the helix to unwind slightly and altering the function of DNA.
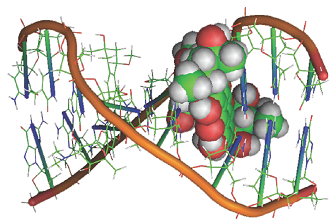
Fig. 1. Some drugs with planar π systems intercalate between base pairs of DNA. [PDB identification number 202D]
Coulombic interactions can be important in the interior of a biopolymer host, where the relative permittivity can be much lower than that of the aqueous exterior. For example, at physiological pH, amino acid side chains containing carboxylic acid or amine groups are negatively and positively charged, respectively, and can attract each other. Dipole–dipole interactions are also possible because many of the building blocks of biopolymers are polar, including the peptide link, -CONH-. However, hydrogen bonding interactions are by far the most prevalent in biological host–guest complexes. Many effective drugs bind tightly and inhibit the action of enzymes that are associated with the progress of a disease. In many cases, a successful inhibitor will be able to form the same hydrogen bonds with the binding site that the normal substrate of the enzyme can form, except that the drug is chemically inert towards the enzyme.
There are two main strategies for the discovery of a drug. In structure-based design, new drugs are developed on the basis of the known structure of the receptor site of a known target. However, in many cases a number of so-called lead compounds are known to have some biological activity but little information is available about the target. To design a molecule with improved pharmacological efficacy, quantitative structure–activity relationships (QSAR) are often established by correlating data on activity of lead compounds with molecular properties, also called molecular descriptors, which can be determined either experimentally or computationally.
In broad terms, the first stage of the QSAR method consists of compiling molecular descriptors for a very large number of lead compounds. Descriptors such as molar mass, molecular dimensions and volume, and relative solubility in water and nonpolar solvents are available from routine experimental procedures. Quantum mechanical descriptors determined by electronic structure computations include bond orders and HOMO and LUMO energies.
In the second stage of the process, biological activity is expressed as a function of the molecular descriptors. An example of a QSAR equation is:
Activity = c0 + c1d1 + c2d12 + c3d2 + c4d22 + ...
where di is the value of the descriptor and ci is a coefficient calculated by fitting the data by regression analysis. The quadratic terms account for the fact that biological activity can have a maximum or minimum value at a specific descriptor value. For example, a molecule might not cross a biological membrane and become available for binding to targets in the interior of the cell if it is too hydrophilic, in which case it will not partition into the hydrophobic layer of the cell membrane, or too hydrophobic, for then it may bind too tightly to the membrane. It follows that the activity will peak at some intermediate value of a parameter that measures the relative solubility of the drug in water and organic solvents.
In the final stage of the QSAR process, the activity of a drug candidate can be estimated from its molecular descriptors and the QSAR equation either by interpolation or extrapolation of the data. The predictions are more reliable when a large number of lead compounds and molecular descriptors are used to generate the QSAR equation.
The traditional QSAR technique has been refined into 3D QSAR, in which sophisticated computational methods are used to gain further insight into the three-dimensional features of drug candidates that lead to tight binding to the receptor site of a target. The process begins by using a computer to superimpose three-dimensional structural models of lead compounds and looking for common features, such as similarities in shape, location of functional groups, and electrostatic potential plots, which can be obtained from molecular orbital calculations. The key assumption of the method is that common structural features are indicative of molecular properties that enhance binding of the drug to the receptor. The collection of superimposed molecules is then placed inside a three-dimensional grid of points. An atomic probe, typically an sp3-hybridized carbon atom, visits each grid point and two energies of interaction are calculated: Esteric, the steric energy reflecting interactions between the probe and electrons in uncharged regions of the drug, and Eelec, the electrostatic energy arising from interactions between the probe and a region of the molecule carrying a partial charge. The measured equilibrium constant for binding of the drug to the target, Kbind, is then assumed to be related to the interaction energies at each point r by the 3D QSAR equation
log Kbind = c0 + ∑r {cs(r)Esteric(r) + cE(r)Eelec(r)}
where the c(r) are coefficients calculated by regression analysis, with the coefficients cS and cE reflecting the relative importance of steric and electrostatic interactions, respectively, at the grid point r. Visualization of the regression analysis is facilitated by colouring each grid point according to the magnitude of the coefficients. Figure 2 shows results of a 3D QSAR analysis of the binding of steroids, molecules with the carbon skeleton shown, to human corticosteroid-binding globulin (CBG). Indeed, it can be seen that the technique lives up to the promise of opening a window into the chemical nature of the binding site even when its structure is not known.
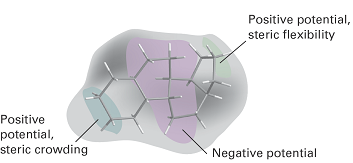
Fig. 2. A 3D QSAR analysis of the binding of steroids, molecules with the carbon skeleton shown, to human corticosteroid-binding globulin (CBG). The ellipses indicate areas in the protein’s binding site with positive or negative electrostatic potentials and with little or much steric crowding. It follows from the calculations that addition of large substituents near the left-hand side of the molecule (as it is drawn on the page) leads to poor affinity of the drug to the binding site. Also, substituents that lead to the accumulation of negative electrostatic potential at either end of the drug are likely to show enhanced affinity for the binding site. [Adapted from P. Krogsgaard-Larsen, T. Liljefors, U. Madsen (ed.), Textbook of drug design and discovery,Taylor & Francis, London (2002).]
The QSAR and 3D QSAR methods, though powerful, have limited power: the predictions are only as good as the data used in the correlations are both reliable and abundant. However, the techniques have been used successfully to identify compounds that deserve further synthetic elaboration, such as addition or removal of functional groups, and testing.