Chapter 1. Why Did You Buy
Introduction
Using Research in the Real World
In this activity, you will complete a comprehensive review of the research skills you have developed as you help a candy company make informed decisions about a new product they would like to introduce to the market.
Dr. Natalie J. Ciarocco, Monmouth University
Dr. David B. Strohmetz, Monmouth University
Dr. Gary W. Lewandowski, Jr., Monmouth University
Something to Think About...
Scenario: You are a junior market research analyst at a firm that has just landed a large account with a candy maker. The company’s most popular candies include mint- and peanut butter-coated milk and dark chocolate pieces. Based on informal customer feedback, the company has decided to introduce a fruit-coated version of this candy, but they are unsure which fruit flavor—banana, cherry, orange, passion fruit, raspberry, or strawberry—would be most successful. It is up to your marketing team to help the candy company determine which fruit flavor would be best to add to their chocolate selections.
Something to Think About...

Basic Research
Applied Research
Program Evaluation
Although we might think that the sole purpose of research is to help us gain knowledge of a topic (as in basic research), we can also use our research skills to solve practical, real-world problems (applied research) that may not immediately seem relevant to the field of psychology. Program evaluation is one example of how you can apply your research skills in a real-world setting. Another example is market research, which involves the gathering and analysis of data about issues relating to marketing products and services. People that work in this field combine aspects of psychology and business to study the best way to attract a customer to a new product. There are many ways to use your research skills to make a difference in peoples’ lives!
Our Research Question

You want to be sure your marketing team has a clear goal for this project, so it is time to determine your research question.
Question 1.1
Which of the following research questions would be best to ask given the goal of your project?
| A. |
| B. |
| C. |
Picking the Best Design

Now that you have a research question (“Which fruit-flavored chocolate would be the best to develop?”), you must decide which type of research design will best answer your research question.
Survey
Experimental Design
Naturalistic Observation
Question 1.2
Which of the following is the best design given your research question?
| A. |
| B. |
| C. |
Developing the Survey
Having decided to use a survey to gather your data, your next step is to decide what type of questions to ask.
Open-ended Questions
Closed-ended Questions
Question 1.3
Which question type should you use to measure people’s preferences for different fruit flavors?
| A. |
| B. |
Developing the Survey
Your team has decided to use a survey with closed-ended questions to collect information about potential flavors. You plan to list 6 fruit flavors that the candy maker can create and ask participants to rate each flavor on a rating scale. These flavors are banana, cherry, orange, passion fruit, raspberry, and strawberry.
Question 1.4
How should you ask participants to evaluate each flavor in your survey?
| A. |
| B. |
| C. |
Developing the Survey
Using your scale, participants will consider the 6 fruit flavors that can be combined with chocolate and rate their liking of each flavor based on 5 response alternatives. Each response alternative will be assigned a numerical value, which you will use to summarize the likeability of each flavor. Higher values indicate a more positive response to the fruit flavor.
| 1 | 2 | 3 | 4 | 5 |
| Like not at all | Like a little bit | Somewhat like | Like quite a bit | Extremely like |
Developing the Survey
Now that you and your team have created a survey to assess preferred fruit flavors to combine with chocolate, you begin thinking about what information would help the candy company market its new product.
Question 1.5
Which of the following information would be most beneficial to include in the survey so that your team can better understand the types of consumers who prefer each fruit flavor?
| A. |
| B. |
| C. |
Finding a Sample

With your newly-developed survey ready, it is time for your team to find the appropriate sample.
Question 1.6
Which of the following samples would be best for your project?
| A. |
| B. |
| C. |
Collecting Data

You work with the computer programmers at your company to set up your online survey and send invitation emails to a list of 2,000 people who previously said they would participate in research for your company. You review this list ahead of time to ensure the participants represent a wide range of ages, socioeconomic statuses, and geographic locations.
After giving their informed consent and confirming they are 18 years of age or older, the participants rate their liking for each of the 6 flavor combinations, report their age category (based on age groups your company generally uses for market research), and report their preferred form of chocolate. You close the survey after 2 weeks and find that 900 of the 2,000 people contacted completed the survey.
Analyzing the Data
This is an example of what your data set would look like. The top row shows the variable names; the other rows display the data for the first 5 respondents. In this data set, the labels for categorical data are displayed.
| Participant | Age Group | Banana | Cherry | Orange | Passion Fruit | Raspberry | Strawberry | Candy Type |
| 1 | 18-30 | 4 | 4 | 2 | 2 | 4 | 3 | Pieces |
| 2 | 56+ | 2 | 5 | 3 | 2 | 5 | 4 | Fun-size |
| 3 | 31-55 | 3 | 5 | 3 | 3 | 4 | 3 | Full-size |
| 4 | 56+ | 2 | 4 | 3 | 3 | 4 | 4 | Fun-size |
| 5 | 18-30 | 1 | 5 | 3 | 2 | 4 | 3 | Pieces |
Analyzing the Data
Now that you have collected your data, you must decide the best way to summarize your findings. The decisions you made about how to collect your data dictate the statistics you can use with your data now. First, you need to consider if your study is descriptive or inferential.
Descriptive
Inferential
Question 1.7
Given your research question (“Which fruit-flavored chocolate would be the best to develop?”) and study design, which of the following is the best statistical method?
| A. |
| B. |
Your Turn: Evaluating Output

The following is the output with the descriptive statistics for your survey results.
| Age | |||||
| Frequency | Percent | Valid Percent | Cumulative Percent | ||
| Valid | 18-30 years | 475 | 52.8 | 52.8 | 52.8 |
| 31-55 years | 250 | 27.8 | 27.8 | 80.6 | |
| 56+ years | 175 | 19.4 | 19.4 | 100.0 | |
| Total | 900 | 100.0 | 100.0 | ||
| Candy_Type | |||||
| Frequency | Percent | Valid Percent | Cumulative Percent | ||
| Valid | Pieces | 432 | 48.0 | 48.0 | 48.0 |
| Fun-size | 259 | 28.8 | 28.8 | 76.8 | |
| Full-size | 209 | 23.2 | 23.2 | 100.0 | |
| Total | 900 | 100.0 | 100.0 | ||
| Descriptive Statistics | |||||
| N | Minimum | Maximum | Mean | Std. Deviation | |
| Banana | 900 | 1 | 5 | 2.80 | .731 |
| Cherry | 900 | 2 | 5 | 4.09 | .625 |
| Orange | 900 | 1 | 5 | 2.90 | .749 |
| Passion | 900 | 1 | 4 | 3.00 | .544 |
| Raspberry | 900 | 3 | 5 | 4.07 | .322 |
| Strawberry | 900 | 2 | 5 | 3.20 | .546 |
| Valid N (listwise) | 900 | ||||
Activity: Graphing Results
To help you visualize your results, adjust the bars to graph the mean liking for each flavor.
| Descriptive Statistics | |||||
| N | Minimum | Maximum | Mean | Std. Deviation | |
| Banana | 900 | 1 | 5 | 2.80 | .731 |
| Cherry | 900 | 2 | 5 | 4.09 | .625 |
| Orange | 900 | 1 | 5 | 2.90 | .749 |
| Passion | 900 | 1 | 4 | 3.00 | .544 |
| Raspberry | 900 | 3 | 5 | 4.07 | .322 |
| Strawberry | 900 | 2 | 5 | 3.20 | .546 |
| Valid N (listwise) | 900 | ||||
Mean Liking for Each Fruit Flavor
Question
Your Turn: Results

Question 1.8
Based on an analysis of the data, what should you tell your client (the candy company)?
| A. |
| B. |
| C. |
Congratulations! You have successfully completed Part 1 of this activity.

Your work on this activity has been saved until you are ready to proceed to Part 2 of the activity.
Something to Think About…
Programmatic Research
Scenario: The work you completed with your team leads your client to develop 2 new candy-coated chocolate flavors (raspberry and cherry). Once the candy is manufactured, the candy maker returns to your marketing team and asks for further help. While they believe both products could be successful, they are only interested in launching 1 of them next year. Per your advice, they ask your team to determine which flavor customers would prefer more. Now it is time for you to delve into programmatic research!
Our Research Question
A new research project means your team needs a new research question.
Question 1.9
Which of the following research questions would be best to ask given the goal of your new project?
| A. |
| B. |
| C. |
Picking the Best Design
Now that you have a research question (“How does flavor influence likeability of a candy-coated chocolate?”), you must decide which type of research design will best answer your research question.
Survey
Two-group Design
Factorial Design
Question 1.10
Which of the following is the best design given your research question?
| A. |
| B. |
| C. |
Picking the Best Design
Now that you know a two-group design is best for this project, you can identify your independent and dependent variables.
Independent Variable (IV)
Dependent Variable (DV)
Question 1.11
Given the research question, what is your independent variable?
| A. |
| B. |
| C. |
Picking the Best Design
Question 1.12
Given your research question, what is your dependent variable?
| A. |
| B. |
| C. |
Operationally Defining the Variables
You already know that the groups in your two-group design will be based on your previous recommendation to the client: One group will taste-test raspberry-flavored chocolate candy pieces and the other will taste-test cherry-flavored chocolate candy pieces. Before proceeding, however, you need to specify the exact nature of your dependent variable: candy likeability.
Question 1.13
Is it better to measure this dependent variable based on what people think or what people do?
| A. |
| B. |
Operationally Defining the Dependent Variable
To gauge what people think, your team decides to create a self-report measure with closed-ended questions to assess various aspects of the candy. To accomplish this task, you develop a Likert scale with 5-point response options (1 = Highly Disagree to 5 = Highly Agree).
Likert Scale
Question 1.14
How many statements would be ideal to include in your likeability measure?
| A. |
| B. |
| C. |
Operationally Defining the Dependent Variable
For your measure, you will ask participants to indicate how much they agree or disagree with 5 statements about the candy fruit flavor they tasted. Your next step is to develop these statements. The key is to have 5 high-quality items that address the likeability of the candy. To avoid an acquiescent response set, we will add at least 1 reversed item.
Acquiescent Response Set
Based on a quick literature review on taste sampling, you decide to have participants indicate how much they agree or disagree with the following statements:
I like the taste of the candy.
I enjoy the texture of the candy.
I like the appearance of the candy.
I dislike the taste of the candy.
Overall, I like the candy.
Determining Your Hypothesis

Now that you have determined what you will manipulate and measure, you must formulate an experimental hypothesis.
Experimental Hypothesis
Question 1.15
Given the nature of your study, which of the following is the best experimental hypothesis?
| A. |
| B. |
Finding a Sample
With your hypothesis prepared, it is time for your team to find an appropriate sample.
Question 1.16
Which of the following samples would be best for your project?
| A. |
| B. |
| C. |
Design in Action
You have determined where you are going to collect your data and now need to schedule a time for data collection.
Question 1.17
When would be the best time for you and your team to collect data?
| A. |
| B. |
| C. |
Design in Action
With your sample, hypothesis, and variables in place, it is now time to think about conducting the study. You need to control the data collection process as much as possible. You also want to be sure your study eliminates any confounds.
Confound
Question 1.18
Which of the following is a potential confound that should be eliminated?
| A. |
| B. |
| C. |
Design in Action
After giving informed consent, participants taste 1 of the 2 flavors—as determined by random assignment—in a private cubicle. They are instructed to sample 3–10 pieces of candy to answer questions about the candy. Regardless of the flavor, all candy pieces are the same size, shape, and color, and are presented in the same disposable bowl for each participant. Once participants feel they have sampled enough of the candy, they complete the self-report measure. When participants finish, they are thanked for their time, debriefed, and released.
Question 1.19
Approximately how many participants should your marketing team recruit for this study?
| A. |
| B. |
| C. |
Collecting Data
You are able to recruit 60 participants from the shopping malls to participate in your study. It is time to see what data from this study might look like.
Example Data Set
This is an example of what your data set would look like. The top row shows the variable names; the other rows display the data for the first 10 participants.
In the “Group” column, a 1 = Cherry and a 2 = Raspberry. The other columns represent responses to each item on the survey.
| Participant | Group | Enjoy_taste | Texture | Appearance | Dislike_taste | Overall |
| 1 | 1 | 5 | 4 | 4 | 1 | 5 |
| 2 | 2 | 2 | 2 | 3 | 4 | 2 |
| 3 | 2 | 3 | 3 | 5 | 3 | 3 |
| 4 | 1 | 4 | 5 | 1 | 2 | 5 |
| 5 | 2 | 2 | 1 | 3 | 2 | 4 |
| 6 | 1 | 5 | 4 | 3 | 2 | 4 |
| 7 | 2 | 1 | 2 | 4 | 4 | 3 |
| 8 | 1 | 3 | 3 | 2 | 3 | 4 |
| 9 | 2 | 4 | 3 | 4 | 5 | 1 |
| 10 | 1 | 4 | 2 | 2 | 1 | 3 |
Selecting the Proper Tool
Now that you have finished running the study, you must decide the best way to analyze your data. The decisions you made about how to collect your data dictate the statistics you can use with your data now.
Question 1.20
Given the nature of your experiment, which of the following is the best analysis to use?
| A. |
| B. |
| C. |
Your Turn: Evaluating Output
Each participant’s overall likeability score was calculated by first reverse-coding the “dislike taste” statement and then taking the mean of the ratings for all 5 scale items. This score is the dependent variable you are testing.
Below is the output from your study.
| Group Statistics | |||||
| Candy | N | Mean | Std. Deviation | Std. Error Mean | |
| Mean_Likeability | Cherry | 30 | 3.7800 | .67983 | .12412 |
| Raspberry | 30 | 3.3970 | .57894 | .10570 | |
| Independent Samples Test | ||||||||||
| Levene's Test for Equality of Variances | t-test for Equality of Means | |||||||||
| F | Sig. | t | df | Sig. (2-tailed) | Mean Difference | Std. Error Difference | 95% Confidence Interval of the Difference | |||
| Lower | Upper | |||||||||
| Mean_Likeability | Equal variances assumed | .089 | .766 | 2.349 | 58 | .022 | .38300 | .16303 | .05667 | .70933 |
| Equal variances not assumed | 2.349 | 56.565 | .022 | .38300 | .16303 | .05649 | .70951 | |||
Your Turn: Results
Question 1.21
What should your team conclude based on this data, and what recommendation should your team make to your client, the candy maker?
| A. |
| B. |
| C. |
Congratulations! You have successfully completed Part 2 of this activity.
Your work on this activity has been saved until you are ready to proceed to Part 3 of the activity.
Something to Think About…
Scenario: Based on your team’s recommendation, the candy maker is almost ready to go into production of the cherry-flavored chocolate. But 2 issues remain: due to the ingredients required, the cherry-flavored chocolate is more costly to make than other flavors, and the color of the new candy is yet to be determined. For your client to achieve success, consumers must be willing to pay a little more for this flavor, and they must be able to distinguish this flavor from the others. To address these issues, your research team is asked to step in once more.
Our Research Question
To ensure the team stays on track, it is time to determine a new research question.
Question 1.22
Which of the following research questions would be best to ask given the goal of our new project?
| A. |
| B. |
| C. |
Picking the Best Design
Now that you have a new research question (“How does the color and price of the candy influence its likeability?”), you must decide which type of research design will best answer your research question.
Survey
Focus Group
Experimental Design
Question 1.23
Which of the following is the best design given your research question?
| A. |
| B. |
| C. |
Picking the Best Design
Now that you have established that an experiment is best given your research question and goals, consider the following experimental designs:
Multigroup Design
Two-group Design
Factorial Design
Question 1.24
Which of the following is the best design given your research question?
| A. |
| B. |
| C. |
Defining the Independent Variables
Question 1.25
Based on your research question (“How does the color and price of the candy influence its likeability?”), what should be the independent variable(s) for your experiment?
| A. |
| B. |
| C. |
Operationally Defining the Independent Variables
After talking to your client, you discover that they are considering 2 colors for this product: a solid rose color and a swirled pattern of light brown and rose. The coloring process for each is of equivalent cost to the candy maker.
In addition, you learn that the candy maker sells their current flavors of candy pieces for 99 cents, but is hoping consumers will be willing to purchase the new product for $1.25 in order to make up for the more expensive fruit-flavored ingredients.
Question 1.26
Based on this information, how should you manipulate the independent variables for the study experiment?
| A. |
| B. |
| C. |
Visual Depiction of Design
Below is a visual depiction of this study design. Participants will be randomly assigned to 1 of 4 conditions, or combinations of independent variables.
| Color | |||
| Rose | Swirl (rose and brown) | ||
| Price | $.99 | Condition 1 | Condition 2 |
| $1.25 | Condition 3 | Condition 4 | |
Identifying and Operationally Defining the Dependent Variable
Question 1.27
Given your research question, which of the following is the better way to measure your dependent variable?
| A. |
| B. |
Determining Your Hypothesis
Now that you have determined what you will manipulate and measure, you must formulate an experimental hypothesis. Because we have multiple independent variables, we will also need multiple hypotheses.
Question 1.28
Considering you are conducting a 2 x 2 factorial design, which of the following hypotheses should you formulate?
| A. |
| B. |
| C. |
Determining Your Hypothesis
In this phase of the project, your client is not expecting any particular outcomes, and just wants to use empirical research to make an informed decision. However, your team believes that people will prefer the candy when it has the swirled rose and brown coloring over the plain rose color, as past research you have conducted indicates that people like novel things better. Your team also expects people will like the candy more when it is priced at 99 cents, not $1.25. Additionally, you expect that the combination of swirled color and 99-cent pricing will significantly increase likeability compared to all other combinations.
Finding a Sample
Before you can conduct your experiment, you need to determine exactly whom you want to study and where you can obtain this target sample. You are again interested in the average consumer, so you head back to the mall to collect your data. Like before, you will conduct the study at various locations, on various days, at various times to be sure you have a diverse sample to represent your population of interest (chocolate candy consumers).
Question 1.29
Approximately how many participants should your marketing team recruit for this study?
| A. |
| B. |
| C. |
Design in Action
After giving informed consent, participants taste candy in 1 of the 2 colors—as determined by random assignment—in a private cubicle. They are instructed to sample 3–10 pieces of candy to answer questions about the candy. Regardless of the color, all candy pieces are the same size, shape, and flavor (cherry), and are presented in the same disposable bowl for each participant.
Also as per random assignment, there is a sign next to the candy bowl that states whether the price of the candy is 99 cents or $1.25. The prices are written in the same font and size. Once the participants feel they have sampled enough of the candy, and have looked at its price, they complete the self-report measure. When participants finish, they are thanked for their time, debriefed, and released.
Collecting Data
You are able to recruit 120 participants from the shopping malls to participate in your study. It is time to see what data from this part of the study might look like.
Example Data Set
This is an example of what your data set would look like. The top row shows the variable names; the other rows display the data for the first 10 participants.
In the “Color” column is the color of the candy (rose or swirl). In the “Price” column is the price on the sign (99 cents or $1.25). The other columns represent responses to each item on the Likert scale.
| Participant | Color | Price | Enjoy_taste | Texture | Appearance | Dislike_taste | Overall |
| 1 | Rose | 99 cents | 5 | 4 | 4 | 1 | 5 |
| 2 | Swirl | 99 cents | 2 | 2 | 3 | 4 | 2 |
| 3 | Swirl | 99 cents | 3 | 3 | 5 | 3 | 3 |
| 4 | Rose | $1.25 | 4 | 5 | 1 | 2 | 5 |
| 5 | Swirl | $1.25 | 2 | 1 | 3 | 2 | 4 |
| 6 | Rose | 99 cents | 5 | 4 | 3 | 2 | 4 |
| 7 | Swirl | $1.25 | 1 | 2 | 4 | 4 | 3 |
| 8 | Rose | 99 cents | 3 | 3 | 2 | 3 | 4 |
| 9 | Swirl | $1.25 | 4 | 3 | 4 | 5 | 1 |
| 10 | Rose | 99 cents | 4 | 2 | 2 | 1 | 3 |
Selecting the Proper Tool
Now that you have finished running the study, you must decide the best way to analyze your data. The decisions you made about how to collect your data dictate the statistics you can use with your data now.
Question 1.30
Given the nature of your experiment, which of the following is the best analysis to use?
| A. |
| B. |
| C. |
Your Turn: Evaluating Output
Each participant’s overall likeability score was calculated by first reverse-coding the “dislike taste” statement and then taking the mean of the ratings for all 5 scale items. This score is the dependent variable you are testing.
Below is the output from your study.
| Descriptive Statistics | ||||
| Dependent Variable: Mean_Likeability | ||||
| Price | Color | Mean | Std. Deviation | N |
| 99 cents | Rose | 3.1203 | .58986 | 30 |
| Rose & Swirl | 3.6997 | .51005 | 30 | |
| Total | 3.4100 | .61985 | 60 | |
| $1.25 | Rose | 3.2000 | .70660 | 30 |
| Rose & Swirl | 3.8997 | .43035 | 30 | |
| Total | 3.5498 | .67890 | 60 | |
| Total | Rose | 3.1602 | .64656 | 60 |
| Rose & Swirl | 3.7997 | .47861 | 60 | |
| Total | 3.4799 | .65111 | 120 | |
| Tests of Between-Subjects Effects | |||||
| Dependent Variable: Mean_Likeability | |||||
| Source | Type III Sum of Squares | df | Mean Square | F | Sig. |
| Corrected Model | 12.964a | 3 | 4.321 | 13.373 | .000 |
| Intercept | 1453.178 | 1 | 1453.178 | 4497.001 | .000 |
| Price | .587 | 1 | .587 | 1.815 | .181 |
| Color | 12.269 | 1 | 12.269 | 37.967 | .000 |
| Price * Color | .109 | 1 | .109 | .336 | .563 |
| Error | 37.485 | 116 | .323 | ||
| Total | 1503.627 | 120 | |||
| Corrected Total | 50.449 | 119 | |||
| a. R Squared = .257 (Adjusted R Squared = .238) | |||||
Your Turn: Results
Question 1.31
What should your team conclude based on the data and analysis, and what recommendation should your team make to your client, the candy maker?
| A. |
| B. |
| C. |
Congratulations! You have successfully completed Part 3 of this activity.
Your work on this activity has been saved until you are ready to proceed to Part 4 of the activity.
Something to Think About…
Scenario: Your client is so pleased with your work that they ask you to take on 1 final project: With the flavor, color, and price of the candy established, the candy maker wants to know more about how to market the product. The client plans to invest a substantial amount in advertising the new flavor, and they want to make sure they have sound research to back up their marketing campaign.
Your team needs to switch focus from helping to develop the best candy to selling this candy the right way to consumers. Good thing your research skills can be applied to so many areas! And even better—your boss told your team that if this final research phase goes well, the whole team will receive a bonus.
Our Research Question
Your team has a new focus and, therefore, needs a new research question.
Question 1.32
Which of the following research questions would be best to ask given the goal of our new project?
| A. |
| B. |
| C. |
Picking the Best Research Approach
Now that you have a research question (“What is the best way to sell cherry-flavored chocolate pieces?”), you must decide which research approach to use to answer this question. There are 2 research methods you can choose from:
Qualitative Research
Quantitative Research
Question 1.33
Should you use a qualitative or quantitative research approach to answer your question?
| A. |
| B. |
Picking the Best Design
The next step is to determine which qualitative data collection technique is best suited for your research question. Below are a few of the techniques you can choose from:
Focus Group
Interview
Narrative Analysis
Question 1.34
Which data collection technique is best for investigating how to sell the new candy flavor?
| A. |
| B. |
| C. |
Determining Your Questions
While you want people to talk freely in a focus group, you still need to establish a planned list of questions for them to answer. These questions will help the discussion stay on track, while allowing you to get the information you need through the flexibility of unplanned follow-up questions. But before you figure out what to ask, you need to determine the best number of questions to ask.
Question 1.35
Which of the following is the ideal number of planned questions to develop for the focus group?
| A. |
| B. |
| C. |
Determining Your Questions
Question 1.36
Now that you have established the ideal number of planned questions to ask, what is the most important thing to keep in mind while developing the questions themselves?
| A. |
| B. |
| C. |
Determining Your Questions
Your team determines that they want to learn about participants’ typical chocolate consumption. They also want to know what participants think about your client’s new product and how they might use it. You draft the following 5 questions for your focus group:
What role does chocolate play in your weekly eating habits?
What are your first thoughts after trying this new candy?
What aspects of the candy do you like and dislike?
Who would you buy this product for (e.g., for yourself, for a friend’s party, for your children)?
When do you think you would likely eat this candy (e.g., at night as a treat, after lunch, for a snack)?
Finding a Sample
As you plan your study, you need to identify your sample. In this case, you want to target people that are most likely to buy the new product. These are the people the candy maker will want to focus on for their advertising campaign, so they are your target population.
Question 1.37
Given your research goals, which of the following samples should you use for your focus group?
| A. |
| B. |
| C. |
Collecting Data
You are ready to start the data collection (focus group) process. After the participants give their informed consent, you will allow them to eat as many of the cherry-flavored chocolate pieces as they like. You will then moderate the focus group, asking the planned questions in a predetermined order, and following up with other questions to clarify meaning and elicit additional information. In this role, you must be as unbiased as possible. You may also need to keep some people from dominating the discussion by encouraging others to contribute more. You will video-record the session for later transcription.
You recruit 9 people to contribute to your focus group. After your 90-minute session, the video recording is transcribed.
Example Data Set
Below is an example of transcribed data from the focus group.
| Questions | Representative Statements |
| What role does chocolate play in your weekly eating habits? | I am total chocaholic. I eat something made of chocolate every day. I like chocolate. I eat it when it is around, but I don’t specifically go looking for it. I probably eat it about once a week. |
| What are your first thoughts after trying the candy? | Umm . . . I like it. I was surprised by the cherry flavor at first, but I like it. They are fun. I love it. I was thinking it was like a luxurious treat in the middle of the day. I could take it or leave it. I am not a fan of fruit and chocolate combinations. If it was around, I would eat it though. |
| When do you think you would likely eat this candy? | It seems like a special treat to me. Something I would eat watching my favorite T.V. show after the kids go to bed. It seems like something I would put in a bowl at a party to have people snack on. |
Analyzing the Data
With your data in hand, it is time to consider strategies for analyzing the focus group results. Below are a few of the techniques you can choose from:
Content Analysis
Conversation Analysis
Repeated-measures ANOVA
Question 1.38
Which of the following is the best strategy for analyzing the focus group results?
| A. |
| B. |
| C. |
Your Turn: Evaluating Output
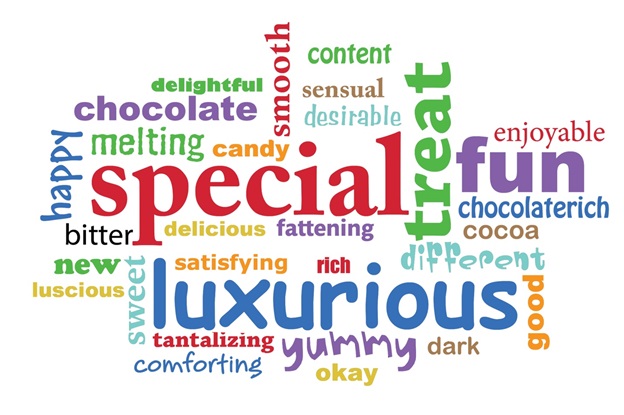
Below is a word cloud generated using key words from the focus group. The frequency of which each word was used is represented by the size of the word.
Your Turn: Results
Question 1.39
What should your team conclude based on your findings from the focus group, and what recommendation should your team make to your client, the candy maker?
| A. |
| B. |
| C. |
Take Home Message

You have conducted 4 studies to help your client develop and market a new product. Great work! You and your team are now eligible for a bonus.
Question 1.40
Based on all of your findings, which statement best summarizes the overall results?
| A. |
| B. |
| C. |
| D. |
Take Home Message
Question 1.41
Based on your experiences as a programmatic market researcher, which of the following statements is true?
| A. |
| B. |
| C. |
| D. |
Congratulations! You have successfully completed all 4 parts of this activity.