Chapter 9. Dressing for Distress?
Introduction
Multigroup Design
This activity will allow you to create a design comparing multiple groups in order to test the impact of different body shapes of dolls on girls' body dissatisfaction.
Dr. Melanie Maggard
Dr. Natalie J. Ciarocco, Monmouth University
Dr. David B. Strohmetz, Monmouth University
Dr. Gary W. Lewandowski, Jr., Monmouth University
Something to Think About...
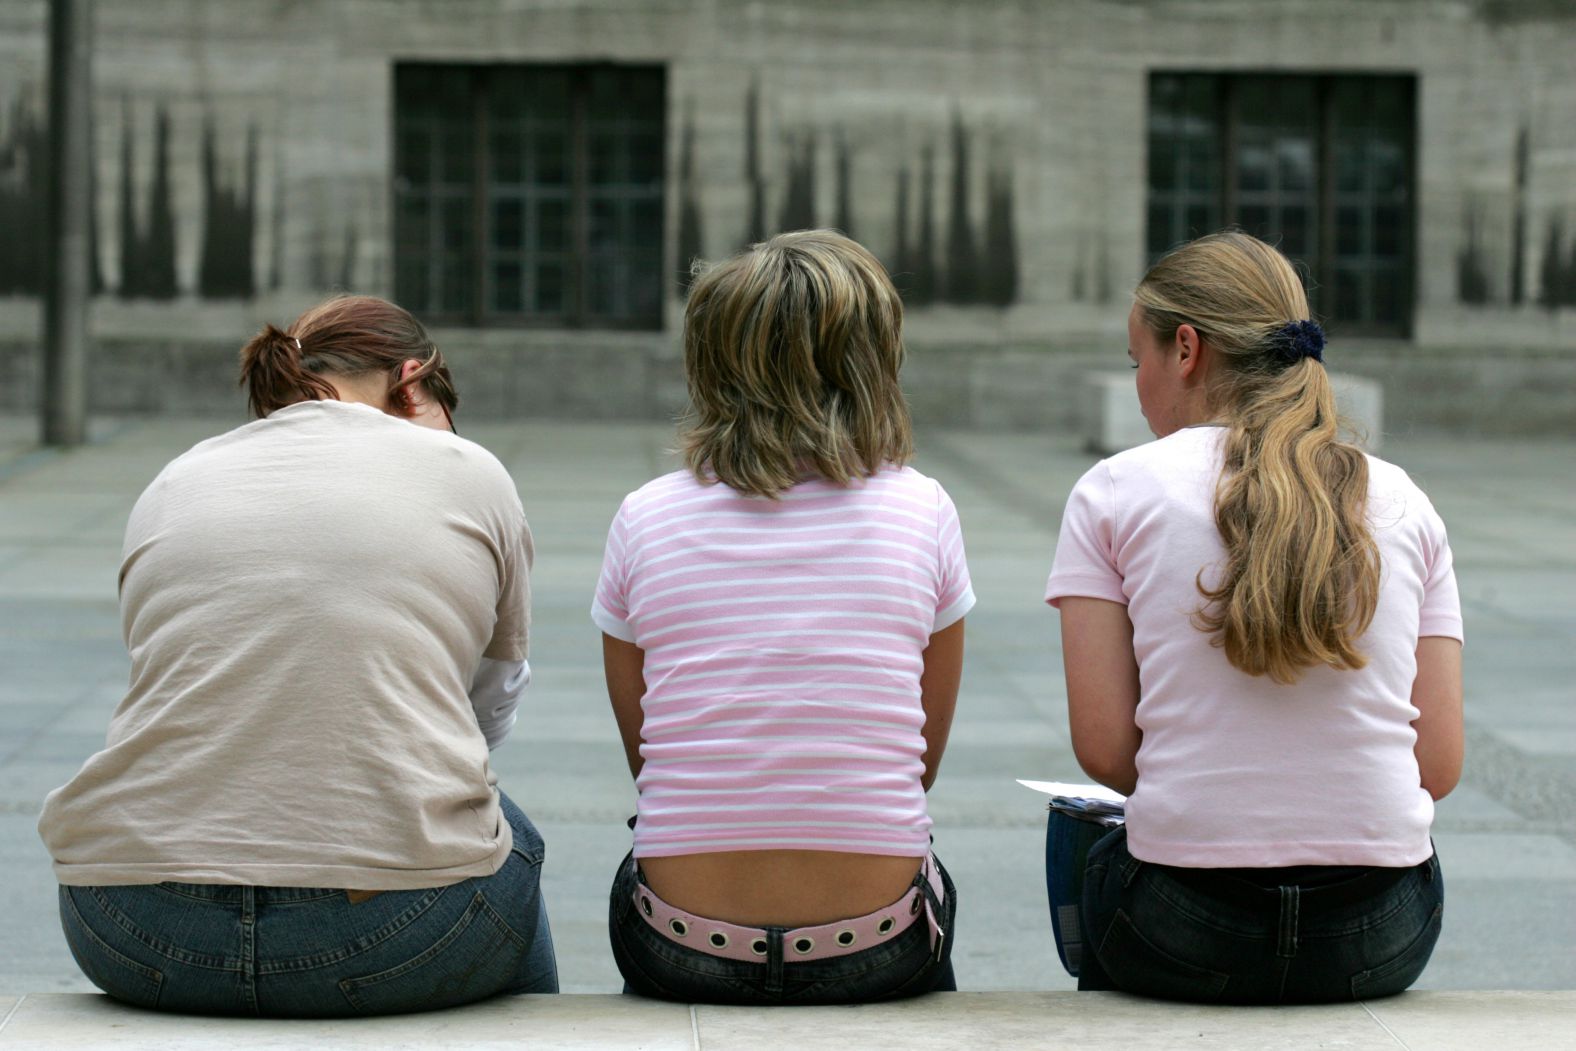
Scenario: We are constantly exposed to images of thin people in the media, through advertisements, movies, television, magazines, and online. These images, whether real or fictional, demonstrate the value our culture places on thinness. Being thin is equated with being beautiful and popular, attributes that girls, in particular, are taught to start valuing at a very young age. Even the toys girls are given—such as dolls with overly thin or unrealistic body types—communicate cultural pressure to be thin.
Something to Think About...

When girls are taught to compare themselves with others, they might begin to believe that, unlike the celebrities they see on TV or the dolls they play with, they are not thin or pretty enough. How might constant exposure to messages about the “thin ideal” influence young girls? Could dolls with unrealistic body proportions influence how satisfied or dissatisfied girls are with their own bodies? It might be possible that a short amount of time spent playing with these dolls is all that is needed for unrealistic body images to negatively impact how girls view their bodies.
Our Research Question

Based on your experiences with or knowledge of dolls that portray thinness, you can develop a research study that examines their impact on body dissatisfaction. But first, you will need a framework to help you explore this topic. Research studies all start with a question, so here is your chance to ask one of your own.
Question 9.1
Which of the following research questions would be best to ask given the goal of our study?
| A. |
| B. |
| C. |
Picking the Best Design
Now that you have a research question (“Does exposure to dolls with unrealistically thin body proportions lead to greater body dissatisfaction in girls?”), you must decide which type of research design will best answer your research question. To narrow things down, consider the following:
Nonexperimental
Experimental Design
Question
Does your research question require a nonexperimental design or an experimental design?
| A. |
| B. |
Picking the Best Design
Having decided that your research question requires a comparison between groups, you must determine the best comparison to make.
Question
Given the research question (“Does exposure to dolls with unrealistically thin body proportions lead to greater body dissatisfaction in girls?”), which comparison is best?
| A. |
| B. |
| C. |
Picking the Best Design
Now that you know you have an experimental design that compares exposure to extremely thin dolls, realistic-looking dolls, and no dolls, you can identify your independent and dependent variables.
Independent Variable (IV)
Dependent Variable (DV)
Question 9.2
Given the research question (“Does exposure to dolls with unrealistically thin body proportions lead to greater body dissatisfaction in girls?”), what is your independent variable?
| A. |
| B. |
| C. |
Picking the Best Design
Question 9.3
Given the research question (“Does exposure to dolls with unrealistically thin body proportions lead to greater body dissatisfaction in girls?”), what is your dependent variable?
| A. |
| B. |
| C. |
Identifying Groups
Because you have an experiment with 1 independent variable and 3 levels (extremely thin dolls vs. realistic-looking dolls vs. no dolls), you have a multigroup design, or experiment with 3 groups. Next we should identify the experimental and control groups.
Experimental Group
Control Group
Empty Control Group
Question 9.4
Based on your research question (“Does exposure to dolls with unrealistically thin body proportions lead to greater body dissatisfaction in girls?”), which is the control group?
| A. |
| B. |
| C. |
Operationally Defining the Independent Variable
Next, we need to operationally define the independent variable (IV) of doll type by determining exactly how we will manipulate it. As we do, we’ll want to be sure our study has a high level of experimental and mundane realism.
Experimental Realism
Mundane Realism
Question
Which of the following study options has the highest level of experimental realism?
| A. |
| B. |
| C. |
Operationally Defining the Independent Variable
Question
Which of the following study options has the highest level of mundane realism in regard to doll-playing activity?
| A. |
| B. |
| C. |
Operationally Defining the Independent Variable
It looks like the task that is highest in experimental and mundane realism involves girls playing with virtual dolls that they are allowed to dress with various outfits and accessories. We know that our experimental group will receive the treatment (i.e., the extremely thin dolls) we are interested in, so now we need to define our control group, which will have the most experimental control.
Experimental Control
Question 9.5
Which of the following options has the highest level of experimental control?
| A. |
| B. |
| C. |
Operationally Defining the Dependent Variable
You have now established the key comparison between the extremely thin dolls vs. realistic-looking dolls vs. no dolls groups. Next, we need to specify the exact nature of our dependent variable, “body dissatisfaction.” First, consider the following:
Question
Which type of measure is better for assessing body dissatisfaction?
| A. |
| B. |
Choosing the Best Measure
We know we want to use a self-report measure to measure body dissatisfaction. Now it is time to determine which type of self-report measure to use. Keep in mind the ideal number and types of questions, reliability and validity, sensitivity, and appropriateness of the measure for young girls.
Reliability
Validity
Sensitivity
Question 9.6
Which of the following would be the best self-report measure of body dissatisfaction in this study?
| A. |
| B. |
| C. |
Determining Your Hypothesis
Now that you have determined what you will manipulate and measure, you must formulate an experimental hypothesis.
Experimental Hypothesis
Question 9.7
Which of the following is the best experimental hypothesis given the nature of your study?
| A. |
| B. |
| C. |
Finding a Sample

Before you can conduct your experiment, you need to determine exactly whom you want to study and where you can find this target sample.
Question 9.8
Which of the following samples would be best for your experiment?
| A. |
| B. |
| C. |
Submitting to the IRB

Now that you have determined how you will collect your data and your intended sample, you must submit your research procedure to the Institutional Review Board (IRB) for ethical approval. The IRB or ethics board will determine whether or not your study meets all ethical guidelines.
IRB
Each IRB has its own protocol which conforms to the national standard when a researcher submits an application for proposed research to be reviewed. In addition to the appropriate paperwork and other information submitted to the IRB, the board would consider the following description during their evaluation of your proposed experiment:
The purpose of this research is to determine whether exposure to unrealistically thin dolls leads to higher body dissatisfaction than does exposure to realistically-proportioned or no dolls. To study this topic, 8- and 9-year-old girls from a local elementary school will be randomly assigned to an extremely thin dolls, realistic-looking dolls, or no dolls group. Those in the thin and realistic dolls groups will be presented with and allowed to dress virtual dolls with outfits and accessories for 5 minutes. Researchers will then measure all participants’ body dissatisfaction using a 2–3 minute self-report measure, the Body Parts Dissatisfaction Scale (BPDS).
Responding to the IRB
The IRB reviewed your submission and has one concern. Although the study appears to present minimal risk to participants, there is no mention of how informed consent will be obtained for the children in the study.
You must now determine how to respond to the IRB, keeping in mind the ethics of surveying vulnerable populations such as children.
Question 9.9
Which of the following is the best response to the IRB’s concern?
| A. |
| B. |
| C. |
Running the Study
Now that we have secured the IRB’s approval, we should determine what the entire study will look like. Below are the steps of the study; can you place them in the proper order?
Collecting Data

Now that you have a sense of how to conduct this study, it is time to see what data from this study might look like.
If you were to run a full version of this study, you would want to have at least 30 participants in each of your three groups, for a total of 90 participants. Because you have a between-subjects design, each participant will only be in one group.
Example Data Set
This is an example of what your data set would look like. The top row shows the variable names; the other rows display the data for the first 10 participants.
In the “Group” column, a 1 = Thin Dolls Group, a 2 = Realistic Dolls Group, and a 3 = No Dolls Group. The Body Parts Dissatisfaction Scale score was recorded under BPDS and represents the number of body parts the participant would like to change to be either smaller or bigger.
| Participant | Group | BPDS |
| 101 | 1 | 6 |
| 102 | 1 | 6 |
| 103 | 2 | 2 |
| 104 | 3 | 1 |
| 105 | 2 | 1 |
| 106 | 1 | 5 |
| 107 | 3 | 2 |
| 108 | 1 | 4 |
| 109 | 2 | 2 |
| 110 | 3 | 2 |
Selecting the Proper Tool

Now that you have collected your data, you must decide the best way to summarize your findings. The decisions you made about how to collect your data dictate the statistics you can use with your data now. First, you need to consider if your study is descriptive or inferential.
Descriptive
Inferential
Question 9.10
Given the nature of your experiment, which of the following is the best statistical method?
| A. |
| B. |
Tutorial: Evaluating Output

The following is an example of output for another three-group design. This study was about how hours slept at night (less than 7 hours, 7–9 hours, and more than 9 hours) influence self-reported happiness.
To report these numbers in a results section, put the numbers in as follows:
F(#,#) = #.##, p = .##, eta2 = .##.
Click on the table below to learn more about each element of the output.
| Sum of Squares | df | Mean Square | F | Sig. | |
| Between Grops | 27.899 | 2 | 13.949 | 30.145 | .000 |
| Within Groups | 44.424 | 96 | .463 | ||
| Total | 72.323 | 98 |
This is the df or degrees of freedom. An ANOVA has two dfs, one for the main effect (between-groups) and one for the error (within-groups).
This is the F statistic. It represents the size of the difference between group means compared to the size of the difference within groups
This is the p level or the significance level. It represents the probability or likelihood that the results happened by chance. The lower the p level, the less likely the result happened by chance.
The F score and p level will only tell you whether there is a significant difference. To determine which means are different, and the nature or direction of those differences, you need to look at the means via a post-hoc test.
| Eta | Eta Squared | |
| happiness * Condition | .621 | .386 |
The eta squared (eta2 ) is the effect size. It tells us the proportion of change in the dependent variable that is associated with being in the different groups of the independent variable.
The eta squared (eta2 ) is the effect size. It tells us the proportion of change in the dependent variable that is associated with being in the different groups of the independent variable.
Tutorial: Evaluating Output
Click on the table below to continue learning about each element of the output.
| (I) Condition | (J) Condition | Mean Difference (I-J) | Std. Error | Sig. | 95% Confidence Interval | |
| Lower Bound | Upper Bound | |||||
| Less than 7 hours sleep | 7-9 hours sleep | -1.06061* | .16747 | .000 | -1.4593 | -.6619 |
| More than 9 hours sleep | .12121 | .16747 | .750 | -.2775 | .5199 | |
| 7-9 hours sleep | Less than 7 hours sleep | 1.06061* | .16747 | .000 | .6619 | 1.4593 |
| More than 9 hours sleep | 1.18182* | .16747 | .000 | .7831 | 1.5805 | |
| More than 9 hours sleep | Less than 7 hours sleep | -.12121 | .16747 | .750 | -.5199 | .2775 |
| 7-9 hours sleep | -1.18182* | .16747 | .000 | -1.5805 | -.7831 | |
*. The mean difference is significant at the 0.05 level.
This is the difference between the means for those who sleep less than 7 hours and between 7 and 9 hours.
This is the difference between the means for those who sleep less than 7 hours and more than 9 hours.
This is the difference between the means for those who sleep between 7 and 9 hours and more than 9 hours.
The post-hoc test tells us which comparisons between the means were significant. The p level tells us the significance level of that comparison.
Those who sleep between 7 and 9 hours are happier than those who sleep less than 7 hours and those who sleep more than 9 hours.
Those who sleep less than 7 hours and more than 9 hours were not different but were equally happy.
Those who sleep less than 7 hours and more than 9 hours were not different but were equally happy.
| Condition | Mean | Std. Deviation | N |
| Less than 7 hours sleep | 3.0303 | .80951 | 33 |
| 7-9 hours sleep | 4.0909 | .72300 | 33 |
| More than 9 hours sleep | 2.9091 | .45851 | 33 |
| Total | 3.3434 | .85906 | 99 |
This is the average or mean (M) happiness rating for those who sleep less than 7 hours.
This is the standard deviation (SD) of happiness for those who sleep less than 7 hours.
This is the average or mean (M) happiness rating for those who sleep between 7 and 9 hours.
This is the standard deviation (SD) of happiness for those who sleep between 7 and 9 hours.
This is the average or mean (M) happiness rating for those who sleep more than 9 hours.
This is the standard deviation (SD) of happiness for those who sleep more than 9 hours.
In this case the means tell us that those who got 7–9 hours of sleep were happier than those who got less than 7 hours of sleep and those that got more than 9 hours of sleep. The results from the post-hoc test support the finding that this group (those who got 7–9 hours of sleep) was statistically different from the other two groups.
Your Turn: Evaluating Output
Below is the output from your study:
| Sum of Squares | df | Mean Square | F | Sig. | |
| Between Groups | 256.822 | 2 | 128.411 | 303.306 | .000 |
| Within Groups | 36.833 | 87 | .423 | ||
| Total | 293.656 | 89 |
| Eta | Eta Squared | |
| BPDS * condition | .935 | .875 |
| (I) Condition | (J) Condition | Mean Difference (I-J) | Std. Error | Sig. | 95% Confidence Interval | |
| Lower Bound | Upper Bound | |||||
|
Thin doll group |
Realistic doll group | 3.600* | .168 | .000 | 3.20 | 4.00 |
| Control group | 3.567 | .168 | .000 | 3.17 | 3.97 | |
| Realistic doll group | Thin doll group | -3.600* | .168 | .000 | -4.00 | -3.20 |
| Control group | -.033 | .168 | .979 | -.43 | .37 | |
| Control group | Thin doll group | -3.567* | .168 | .000 | -3.97 | -3.17 |
| Realistic doll group | .033 | .168 | .979 | -.37 | .43 | |
| N | Mean | Std. Deviation | Std. Error | |
| Thin doll group | 30 | 5.07 | .868 | .159 |
| Realistic doll group | 30 | 1.47 | .507 | .093 |
| Control group | 30 | 1.50 | .509 | .093 |
| Total | 90 | 2.68 | 1.816 | .191 |
Your Turn: Evaluating Output
Based on the results of your statistical analyses, match the correct number in the “Answer” column to the term requested under “Prompt”:
| Prompt | Answer |
| F for the ANOVA test | |
| df for the main effect of group (between-groups) | |
| df for error (within-groups) | |
| p for the ANOVA test | |
| p for the difference between thin doll and realistic doll groups | |
| p for the difference between thin doll and no doll group | |
| p for the difference between realistic doll and no doll groups | |
| eta2 |
Activity: Graphing Results
| BPDS | Descriptives | |||
| N | Mean | Std. Deviation | Std. Error | |
| Thin doll group | 30 | 5.07 | .868 | .159 |
| Realistic doll group | 30 | 1.47 | .507 | .093 |
| Control group | 30 | 1.50 | .509 | .093 |
| Total | 90 | 2.68 | 1.816 | .191 |
Drag the bars of each graph to the correct Mean value.
Dolls & Body Dissatisfaction
Doll Group
Your Turn: Results

Now that you have worked with your data, you must determine the best way to express your findings in written form. You must be sure that how you describe your findings accurately represents the data.
Question 9.11
Based on the statistical analysis, which of the following results sections best fits the data and analyses from your study?
| A. |
| B. |
| C. |
| D. |
9.1 Take Home Message

Now that you have determined how to express your findings in a scientifically responsible way, you also need to be able to talk about what your findings mean in everyday terms so that the world can benefit from your science.
Question
How would you explain what you found about body dissatisfaction in girls to a friend or family member? Select the best option.
| A. |
| B. |
| C. |
| D. |

Congratulations! You have successfully completed this activity.