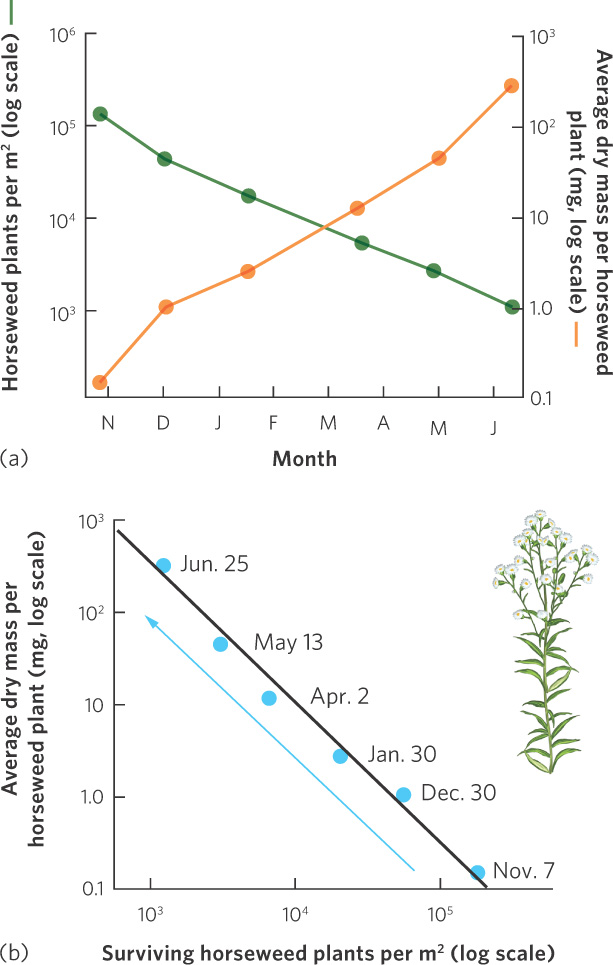
Figure 12.10 Self-thinning curve. Horseweed seeds were sown at a density of 100,000 per m2. (a) Over time, the number of survivors declined by 100 while the average mass of the surviving plants increased by 1,000. (b) When we plot plant density against average mass per plant on log scales, we see it follows a line with a slope of approximately  .
.
.Data from J. Harper, A Darwinian approach to plant ecology, Journal of Ecology 55 (1967): 247–270.