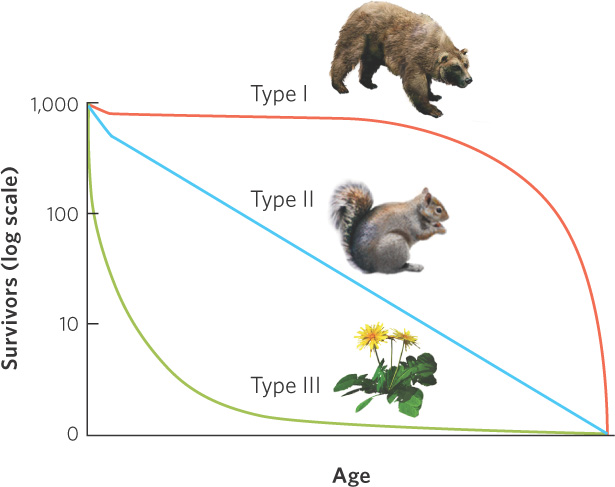
Figure 12.19 Survivorship curves. Individuals that have a type I curve experience high survival until later in life. Individuals with a type II curve experience a steady decline in survival throughout life. Individuals that have a type III curve experience low survival when young and high survival until later in life.