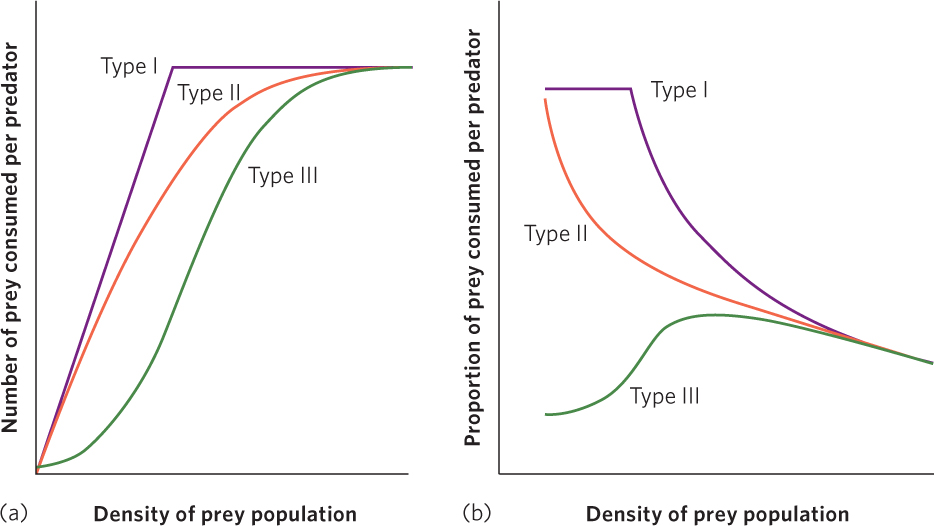
Figure 14.13 Functional responses of predators. (a) When we consider the number of prey consumed per predator, we see that a type I response exhibits a linear relationship between the density of the prey population and the number of prey a predator consumes until eventually the predator is satiated. In contrast, a type II response exhibits a slowing rate of prey consumption as prey density increases; the slowing rate is due to an increase in the time spent handling the additional prey. Eventually, the predator achieves satiation. A type III response also shows a slowing rate of consumption with increased prey density. In addition, this response exhibits the effect of a predator learning a search image for prey as the prey density increases. (b) When we consider the proportion of prey consumed, we see that the type I response results in a constant proportion of prey being consumed—prior to satiation—as prey density increases. A type II response results in a decreasing proportion of prey being consumed. Finally, a type III response initially causes an increased proportion of prey consumed, followed by a decrease.