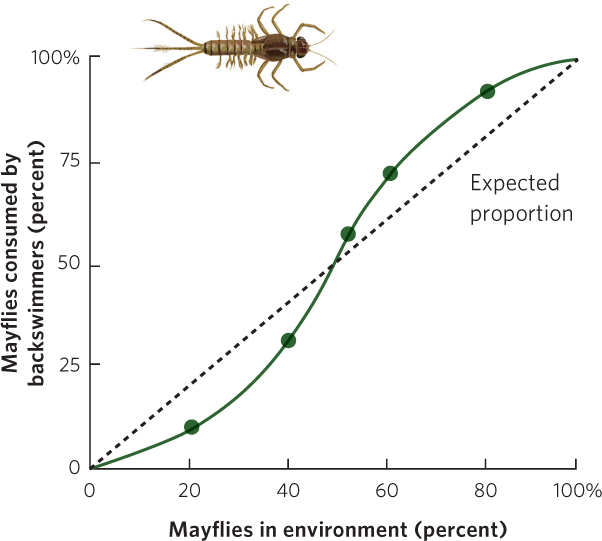
Figure 14.14 A type III functional response. Using predatory insects known as backswimmers, researchers manipulated the proportion of available prey: larval mayflies (shown above the graph) and isopods. The dashed black line indicates the expected proportion of mayflies consumed if the predator’s preference was not affected by the proportional abundance of mayflies. When mayflies were rare, the predator consumed fewer mayflies than expected at random. When mayflies were common, the predator consumed more mayflies than expected at random.
Data from M. Begon and M. Mortimer, Population Ecology, 2nd ed. (Blackwell Scientific Publications, 1981), after J. H. Lawton, J. R. Beddington, and R. Bonser in M. B. Usher and M. H. Williamson (eds.), Ecological Stability, pp. 141–158, (Chapman & Hall, 1974).