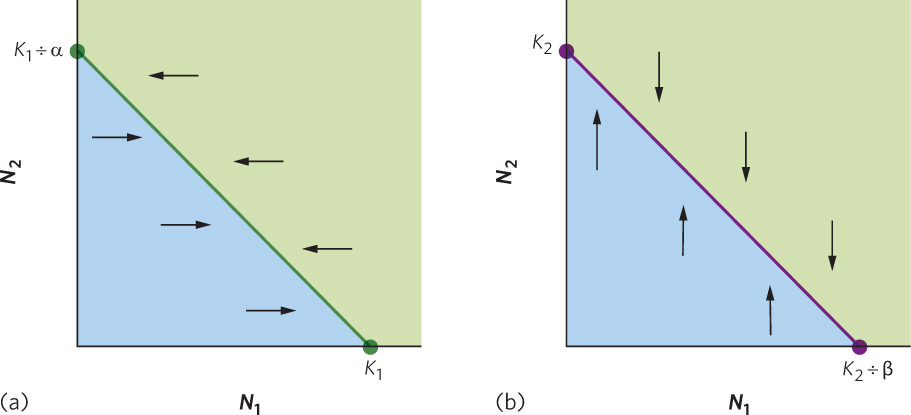
Figure 16.7 Equilibrium population sizes of two species. (a) The equilibrium isocline for species 1, shown as a green line, represents all combinations of species 1’s population sizes (N1) and species 2’s population sizes (N2) that cause species 1 to experience zero growth. When species 2 has an abundance of zero, species 1 will have an abundance of K1, which is the carrying capacity of species 1. (b) The equilibrium isocline for species 2, shown as a purple line, represents all combinations of species 1’s population sizes (N1) and species 2’s population sizes (N2) that cause species 2 to experience zero growth. When species 1 has an abundance of zero, species 2 will have an abundance of K2, which is the carrying capacity of species 2. The arrows indicate how each population either increases or decreases as it moves away from the equilibrium line.