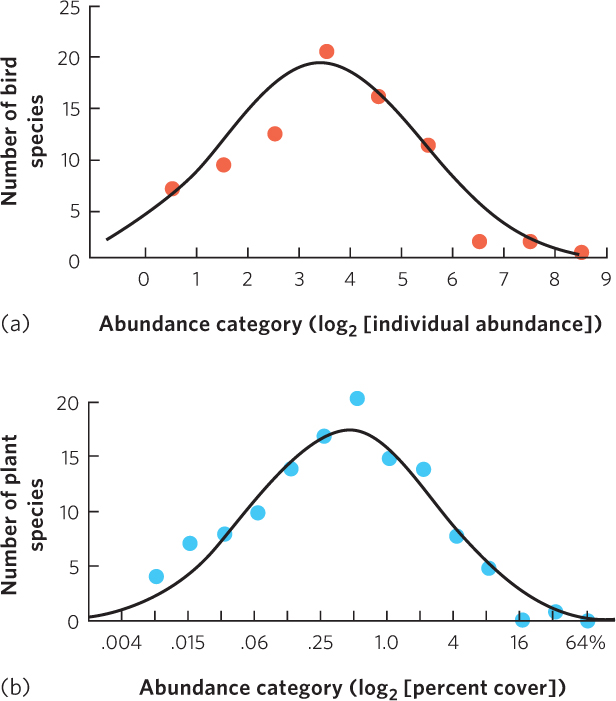
Figure 18.8 Log-normal distributions of species abundance. Log-normal distributions are found by plotting the abundance categories of each species on a log2 scale and then plotting the number of species that contain each abundance category. (a) A 10-year survey of birds in Westerville, Ohio, found that few species had extremely low or high abundances; most bird species had intermediate abundances. (b) A survey of desert plants in Arizona measured abundance using the percent cover of each species rather than the number of individuals of each species and found a similar log-normal distribution.
Data from (a) F. W. Preston, The canonical distribution of commonness and rarity: Part I, Ecology 43 (1962): 185–215; (b) R. H. Whittaker, Dominance and diversity in land plant communities, Science 147 (1965): 250–260.