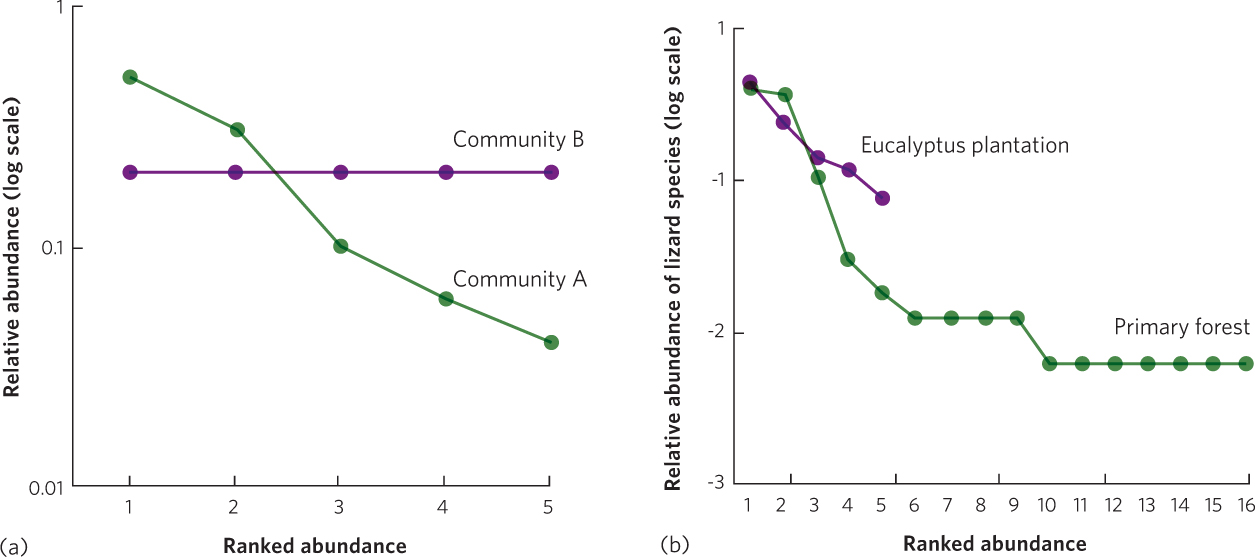
Figure 18.9 Rank-abundance curves. (a) These rank-abundance curves represent two hypothetical communities with identical species richness of five species. However, the two communities differ in species evenness. Community A has one species with a high relative abundance and other species that have moderate to low abundance, which means this community has low species evenness. In contrast, Community B contains five species that are all equally abundant so there is high evenness. (b) These rank-abundance curves for lizards living in Brazil show that the primary forest has a higher species richness and a lower species evenness than the eucalyptus plantation.
Data from M. A. Ribiero-Júnior et al., Evaluating the effectiveness of herptofaunal sampling techniques across a gradient of habitat change in a tropical forest landscape, Journal of Herpetology 42 (2008): 733–749.