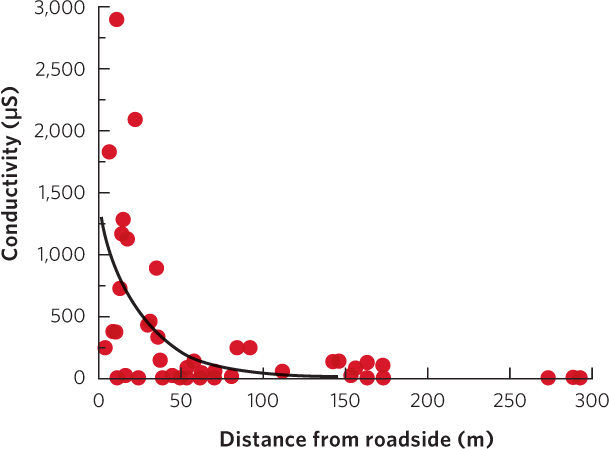
Figure A.3 (Text Figure 2.12) This scatter plot graph shows the relationship between the distance from a pond to the nearest road and the amount of salt in the pond‘s water, which is measured in terms of conductivity. The line of best fit is curved.