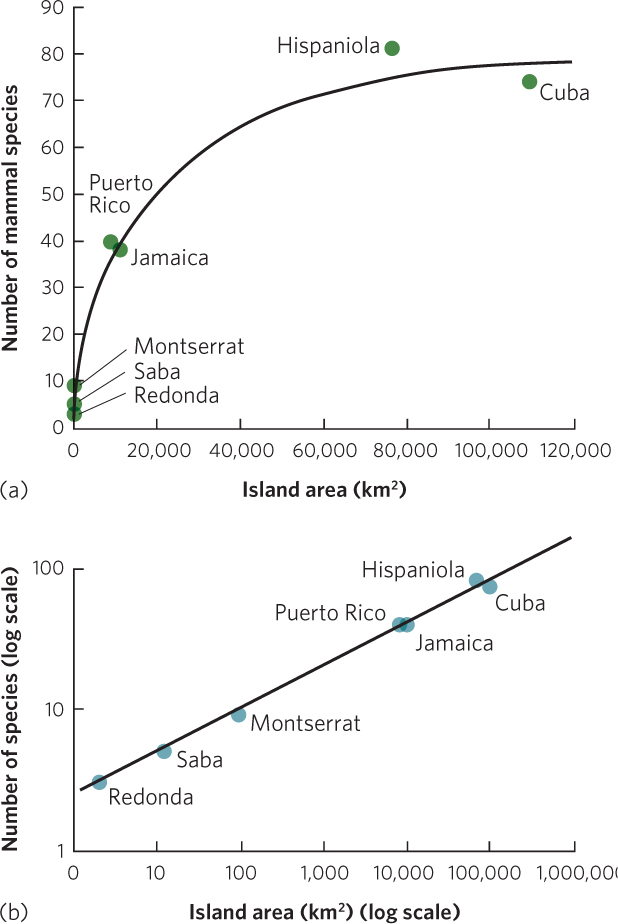
Figure A.4 (Text Figure 22.4) (a) This scatter plot shows the number of amphibian and reptile species on islands of different sizes in the West Indies. Note that the line of best fit is a curved line. (b) When the same data are plotted on a log scale, the line of best fit is a straight line.