Figure A.5
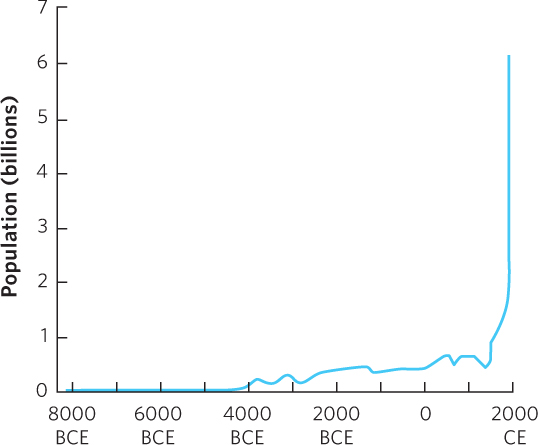
(Text Figure 12.1).
This line graph shows population growth over time by connecting a series of many data points.