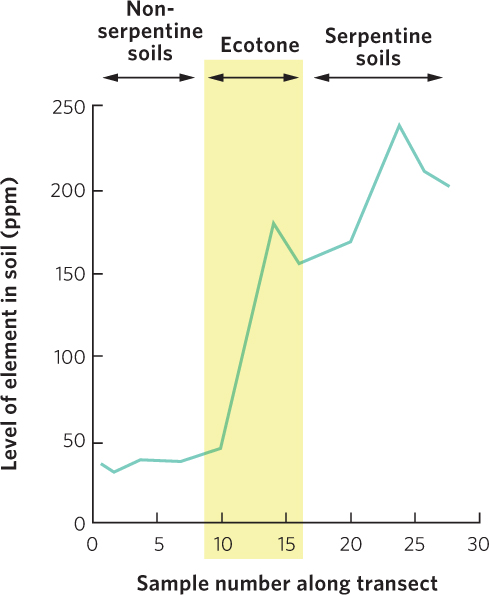
Figure A.6
(Text Figure 18.5).
This line graph shows data measurement over space. It reflects changes in the concentration of chromium in the soil as researchers moved from nonserpentine soils to serpentine soils.