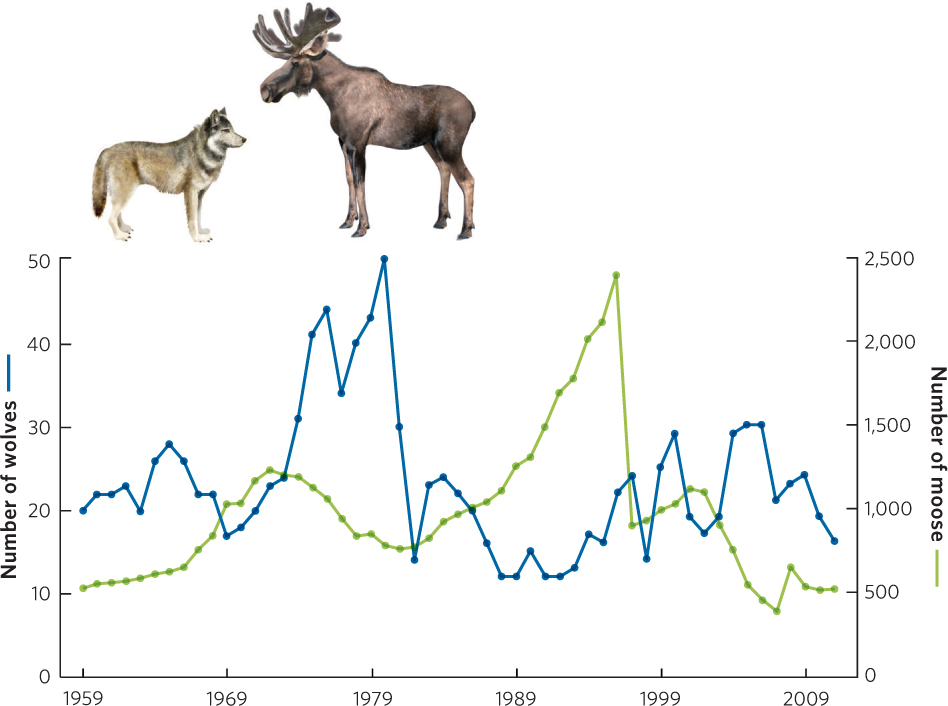
Figure A.8 (Text Figure 13.6) To illustrate changes in the population sizes of wolves and moose over time, researchers used a line graph containing two y axes. The y axis on the left represents the number of wolves and ranges from 0 to 50. In contrast, the y axis on the right represents the number of moose and ranges from 0 to 2,500.