Figure A.9
(Text Figure 8.4).
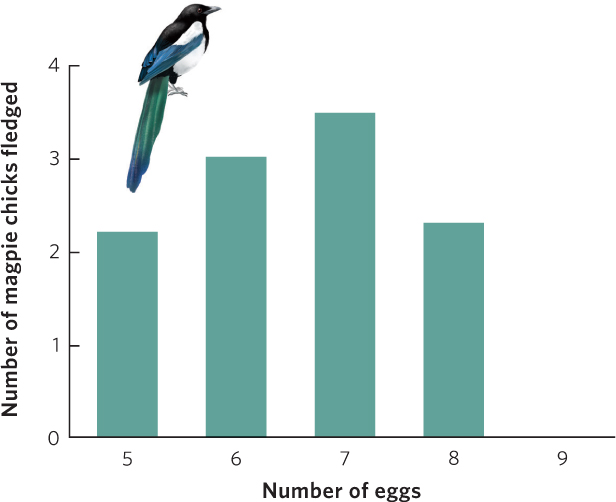
This bar graph shows the relationship between the number of eggs in nests of European magpies, plotted on the
x
axis, and the number of offspring that leave the nest as fledgling birds, plotted on the
y
axis.