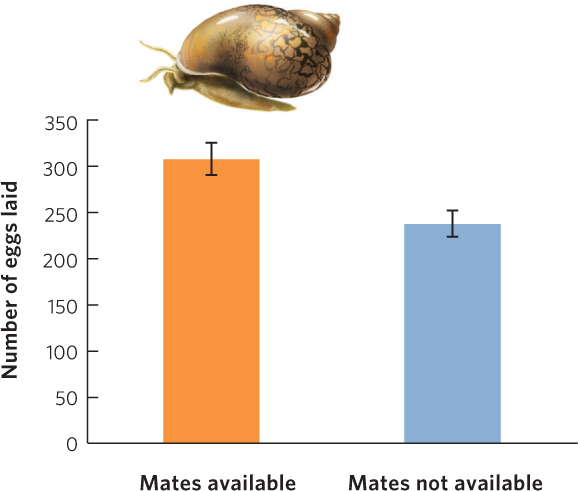
Figure A.10 (Text Figure 4.8). This bar graph shows the number of eggs produced by snails with mates available or not available. In this study, the researchers added error bars to convey the variation in egg laying among individuals. Error bars are standard errors.