Figure A.12
(Text Figure 20.7).
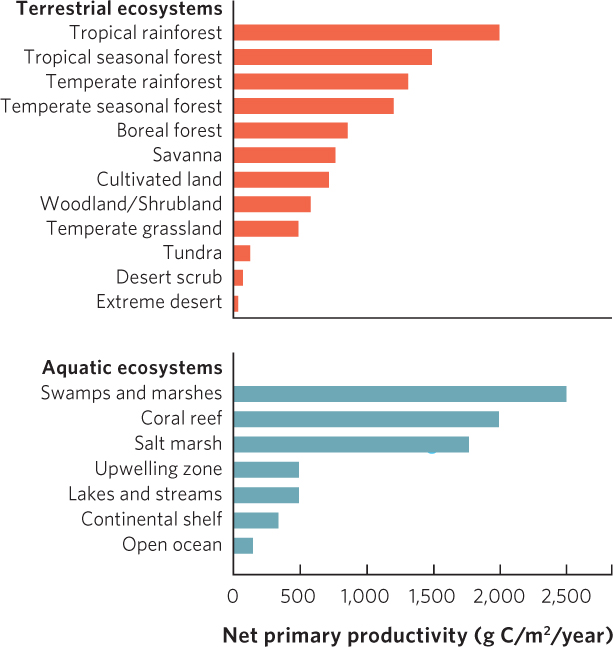
This bar graph shows net primary productivity of ecosystems around the world. In this case, the graph lists the categories on the
y
axis and plots the values on the
x
axis.