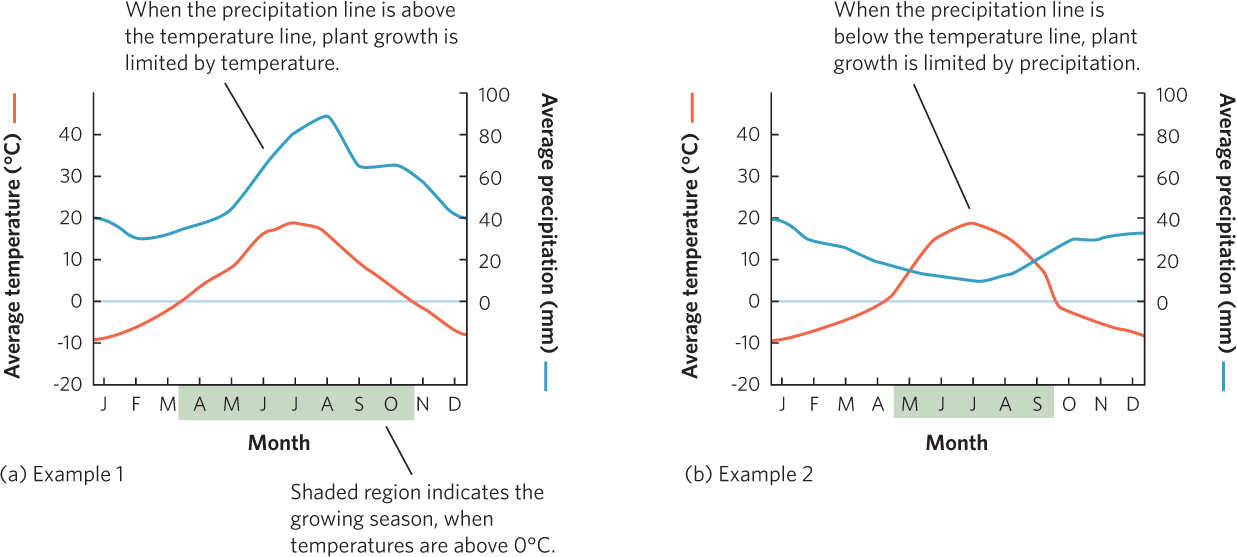
Figure A.14 (Text Figure 6.4). This figure shows two hypothetical climate diagrams. Climate diagrams illustrate patterns of temperature and precipitation throughout the year, the length of the growing season, and whether plant growth is limited by temperature or precipitation.