Figure A.15
(Text Figure 12.18).
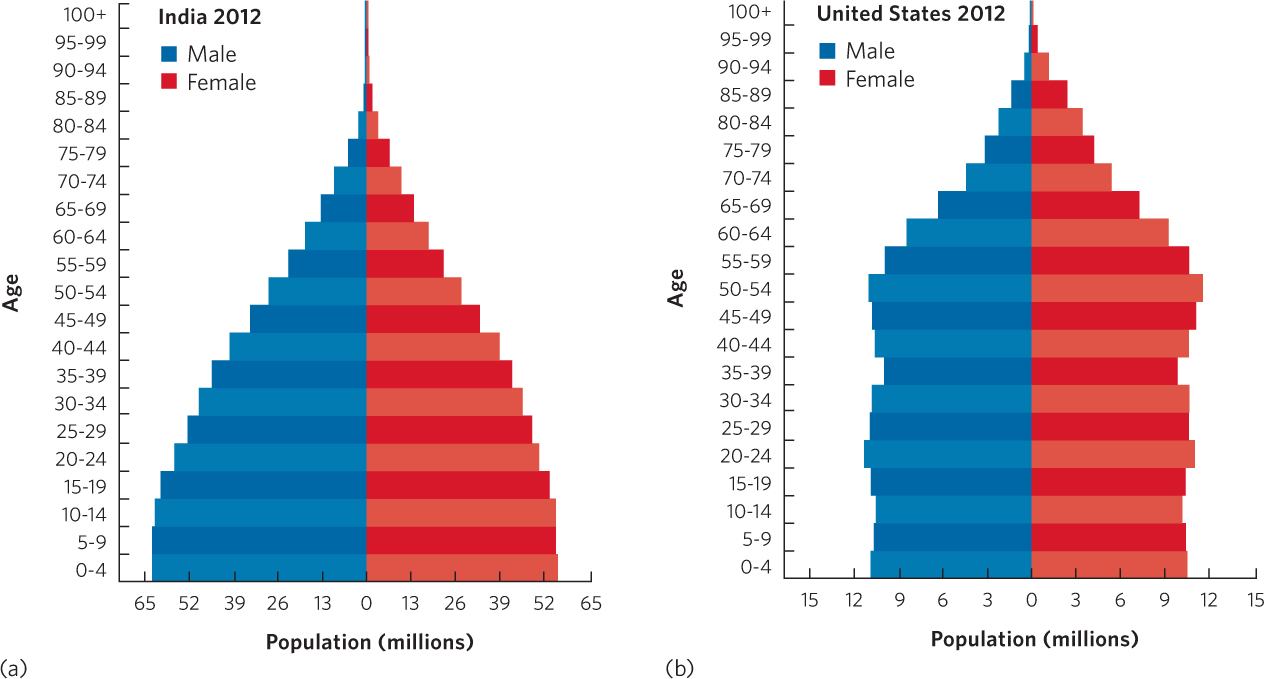
These diagrams portray the age structure of men and women in
(a)
India and
(b)
the United States.