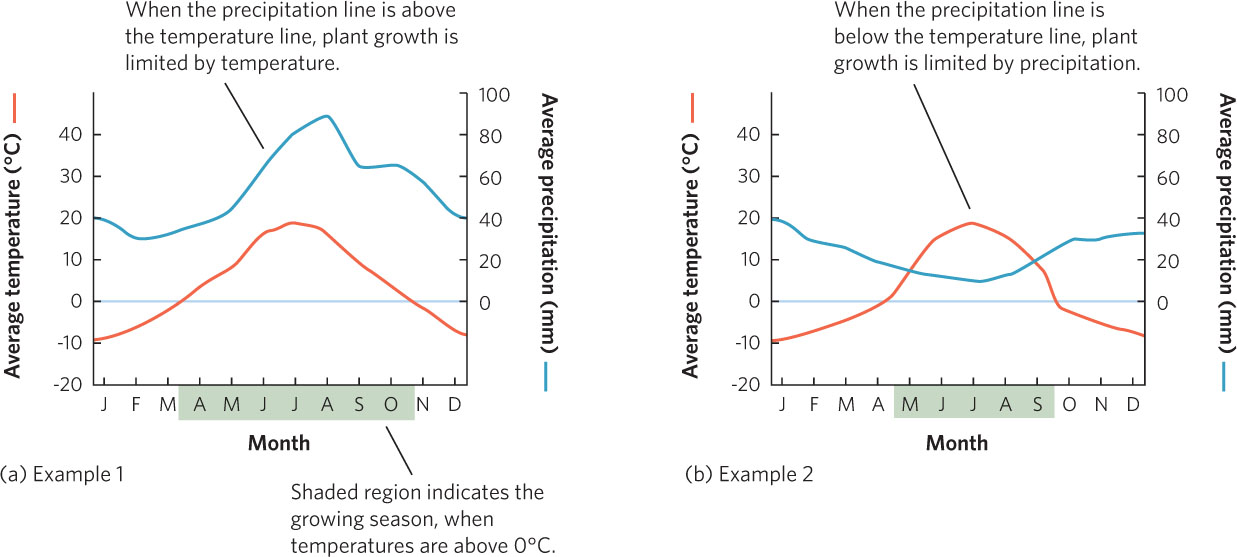
Figure 6.4 Climate diagrams. By plotting the average monthly temperature and precipitation values over time for a particular location on Earth, we can determine how climates vary throughout the year and the length of the growing season. (a) In this hypothetical climate diagram, there is a seven-month growing season and plant growth is limited by temperature throughout the year. (b) In this example, there is a five-month growing season and plant growth is limited by precipitation.