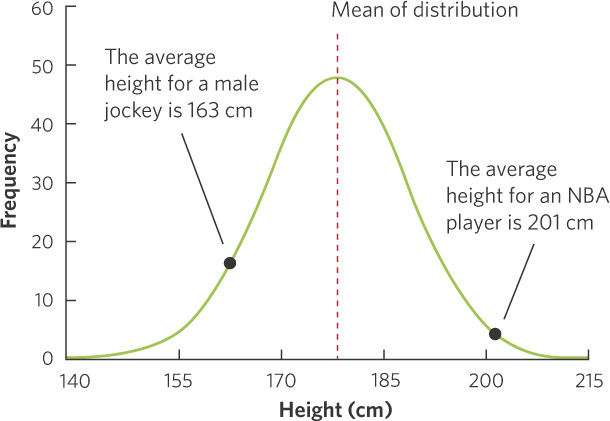
Figure 7.1 Frequency distribution of polygenic traits. When a continuous trait is determined by many genes, the distribution follows a bell-shaped curve. For the heights of adult males in the United States, for example, there is a symmetrical distribution around the mean. Most individuals express an intermediate trait value whereas only a few individuals, such as professional basketball players and jockeys, express extreme trait values.
Data from U.S. Census 2000.