Graphing The Data: How Living in Groups Affects Predation Risk
As we have discussed, living in groups has a number of potential costs and benefits. To determine if living in schools provided an antipredator benefit to minnows, researchers placed different numbers of minnows into aquaria and determined how often schools of different size were approached by a larger species of predatory fish. Using the data in the table and your knowledge about calculating sample standard deviations from Chapter 2, calculate the means and the standard deviations for the number of approaches by a predator per minute as a function of different school sizes. Then graph the means and sample standard deviations using a line graph.
Based on these data, what can you conclude about the effect of school size on the likelihood of predation by the larger species of fish?
|
MINNOW SCHOOL SIZE |
|||||
|---|---|---|---|---|---|
| TRIAL | 3 | 5 | 10 | 15 | 20 |
| 1 | 0.9 | 0.7 | 0.4 | 0.4 | 0.1 |
| 2 | 0.8 | 0.8 | 0.5 | 0.5 | 0.1 |
| 3 | 0.7 | 0.9 | 0.6 | 0.3 | 0.2 |
| 4 | 1.1 | 0.6 | 0.8 | 0.2 | 0.3 |
| 5 | 1.0 | 1.0 | 0.7 | 0.6 | 0.3 |
|
MEAN NUMBER OF APROACHES/ MINUTE |
|||||
|
STANDARD DEVIATION |
|||||
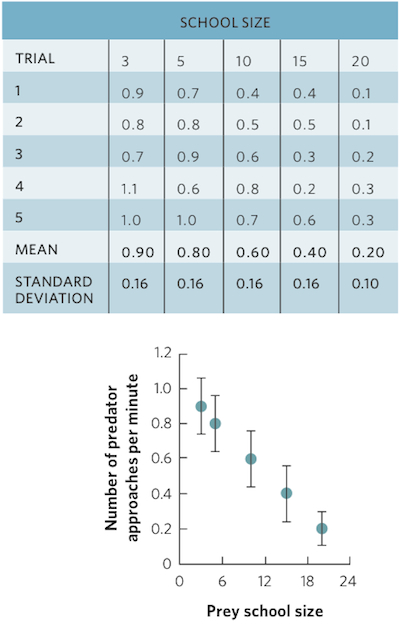
As the size of the prey school increases, there is a decline in the number of times a predator approaches.