Graphing The Data: An Ideal Free Distribution
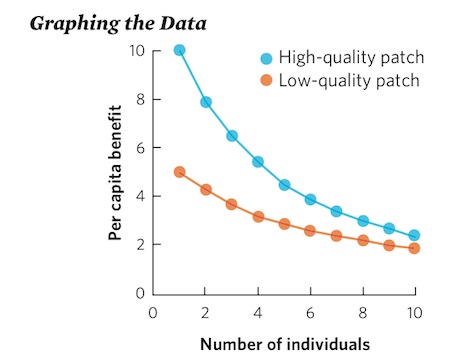
Using the data for high- and low-quality habitats, create a graph that represents how per capita benefit changes as a function of the number of individuals in the patch.
Based on these data, how many individuals must move to the high-quality patch before an individual moves to the low-quality patch? If there were 12 individuals and they followed an ideal free distribution, approximately how many individuals would be in each habitat?
| NUMBER OF INDIVIDUALS | HIGH-QUALITY PATCH PER CAPITA BENEFIT | LOW-QUALITY PATCH PER CAPITA BENEFIT |
|---|---|---|
| 1 | 10.0 | 5.0 |
| 2 | 7.9 | 4.3 |
| 3 | 6.5 | 3.7 |
| 4 | 5.4 | 3.2 |
| 5 | 4.5 | 2.9 |
| 6 | 3.9 | 2.6 |
| 7 | 3.4 | 2.4 |
| 8 | 3.0 | 2.2 |
| 9 | 2.7 | 2.0 |
| 10 | 2.4 | 1.9 |
Once four individuals have arrived at the high-quality patch, the next individual to arrive would receive a larger per capita benefit by moving to the low-quality patch.
If there are 12 individuals, all individuals would gain the highest per capita benefit if 8 individuals remained in the high-quality patch and 4 individuals moved to the low-quality patch.