Population abundance and density are related to geographic range and adult body size
Given the many properties of population distributions, all of which can span a wide range of values, ecologists often search for relationships that might explain the underlying causes of variation in these values. Common patterns include the relationship between population abundance and geographic range and the relationship between population density and adult body size.
260
Population Abundance and Geographic Range
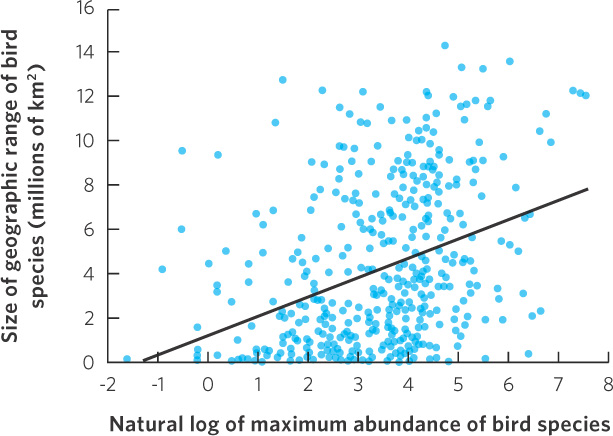
Ecologists have consistently found that populations with high abundance also have a large geographic range. This pattern has been observed in plants, mammals, birds, and protists. Consider the data on the birds of North America in Figure 11.11. We can see a positive relationship; species with the highest abundances also are the species with the largest range sizes. This same pattern was observed in collared lizards; as their abundance declined, fewer glades were occupied and the geographic range of the population shrank. In the bird data, however, there is a great deal of variation around the regression line. If we were to quantify the coefficient of determination, we would find that abundance of the populations only explained 13 percent of the variation in the geographic ranges of the populations. To review the concept of coefficient of determination, see “Analyzing Ecology: Coefficients of Determination” in Chapter 8.

The causes of the range-abundance relationship are still widely debated. There is general consensus that resource availability plays an important role. For example, if a species relies on resources that are only available in a small geographic area, the species will only inhabit a small geographic range. If resources are abundant over a large geographic area, we might expect that species to cover a large geographic range and to be abundant. In short, the distribution of resources should cause a positive relationship between abundance and geographic range.
Although we do see this positive relationship, we are left to wonder about all of the unexplained variation in the relationship shown in Figure 11.11. In some cases, we might be observing fluctuations within a geographic range. For example, individuals might disperse to more marginal habitats during years that favor especially high reproduction and survival. The range would then contract during years that have low reproduction and survival. Such year-to-year fluctuations can cause the data on the abundance and geographic range of a population to vary a great deal. This can account for some of the variability that we see.
The relationship between population abundance and distribution suggests that reducing the geographic range of a population—for example by converting habitat to agricultural purposes or to housing—will also reduce the size of the population. Similarly, factors that reduce the overall size of the population will simultaneously reduce the geographic range of the population because marginal habitats will no longer receive as many dispersing individuals.
Population Density and Adult Body Size
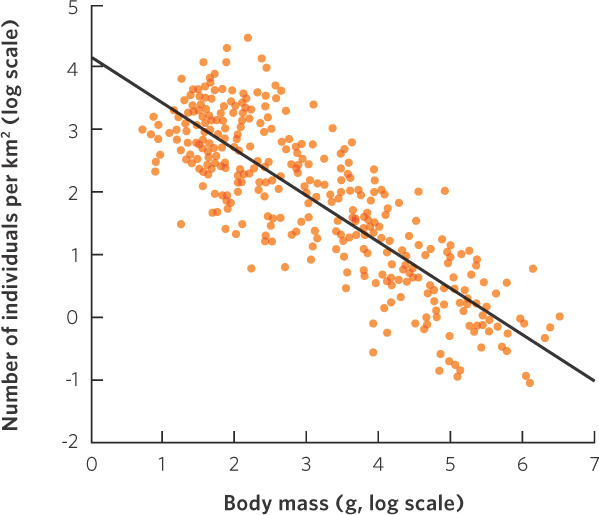
Another common pattern across species is the relationship between population density and body size. Generally, the density of a population is negatively correlated to the body size of the species. Figure 11.12 shows that in herbivorous animals, the smallest-bodied species—such as mice—live at the highest densities, and the largest-bodied species—such as elephants—live at the lowest densities. Part of this relationship is a matter of body size relative to space. A square meter of soil harbors hundreds of thousands of small arthropods, whereas a single elephant simply would not fit into this space. Even if it could be squeezed in, a square meter of soil would not produce enough food to sustain the elephant. A large individual requires more food and other resources than a small one. As a result, we expect a given plot of habitat to support fewer large individuals than it does small individuals.

261