Metapopulations are composed of subpopulations that can experience independent population dynamics across space
We have considered population dynamics over time, but population dynamics also occur over space. Whether on land or in water, species that have a particular geographic range are commonly subdivided into smaller subpopulations. This happens because preferred habitat is not continuous but occurs as patches of suitable habitat that are surrounded by a matrix of unsuitable habitat. When individuals are able to move between patches, we consider the collection of subpopulations to be a metapopulation, a concept that we first introduced in Chapter 11. As you may recall, the example of the collared lizards in Chapter 11 involved a metapopulation that did not live in the entire forest, but rather in glades, where it experienced more favorable temperatures and a more abundant food supply. In this section, we will examine why populations are broken up into metapopulations and review the three types of metapopulation models. We will then examine studies of real metapopulations in nature.
The Fragmented Nature of Habitats
Metapopulations occur when a habitat is fragmented. A good example is the existence of wetlands that are dotted across the landscape of many parts of North America (Figure 13.16). Each wetland can contain populations of many different species of amphibians, crustaceans, snails, and aquatic plants. The terrestrial habitat located between these wetlands is generally inhospitable to these organisms, yet individuals of many species are able to disperse across these intervening regions to arrive at another wetland. As you might guess, the amount of movement among wetlands depends on the distance between neighboring wetlands and how far and fast an individual can move.
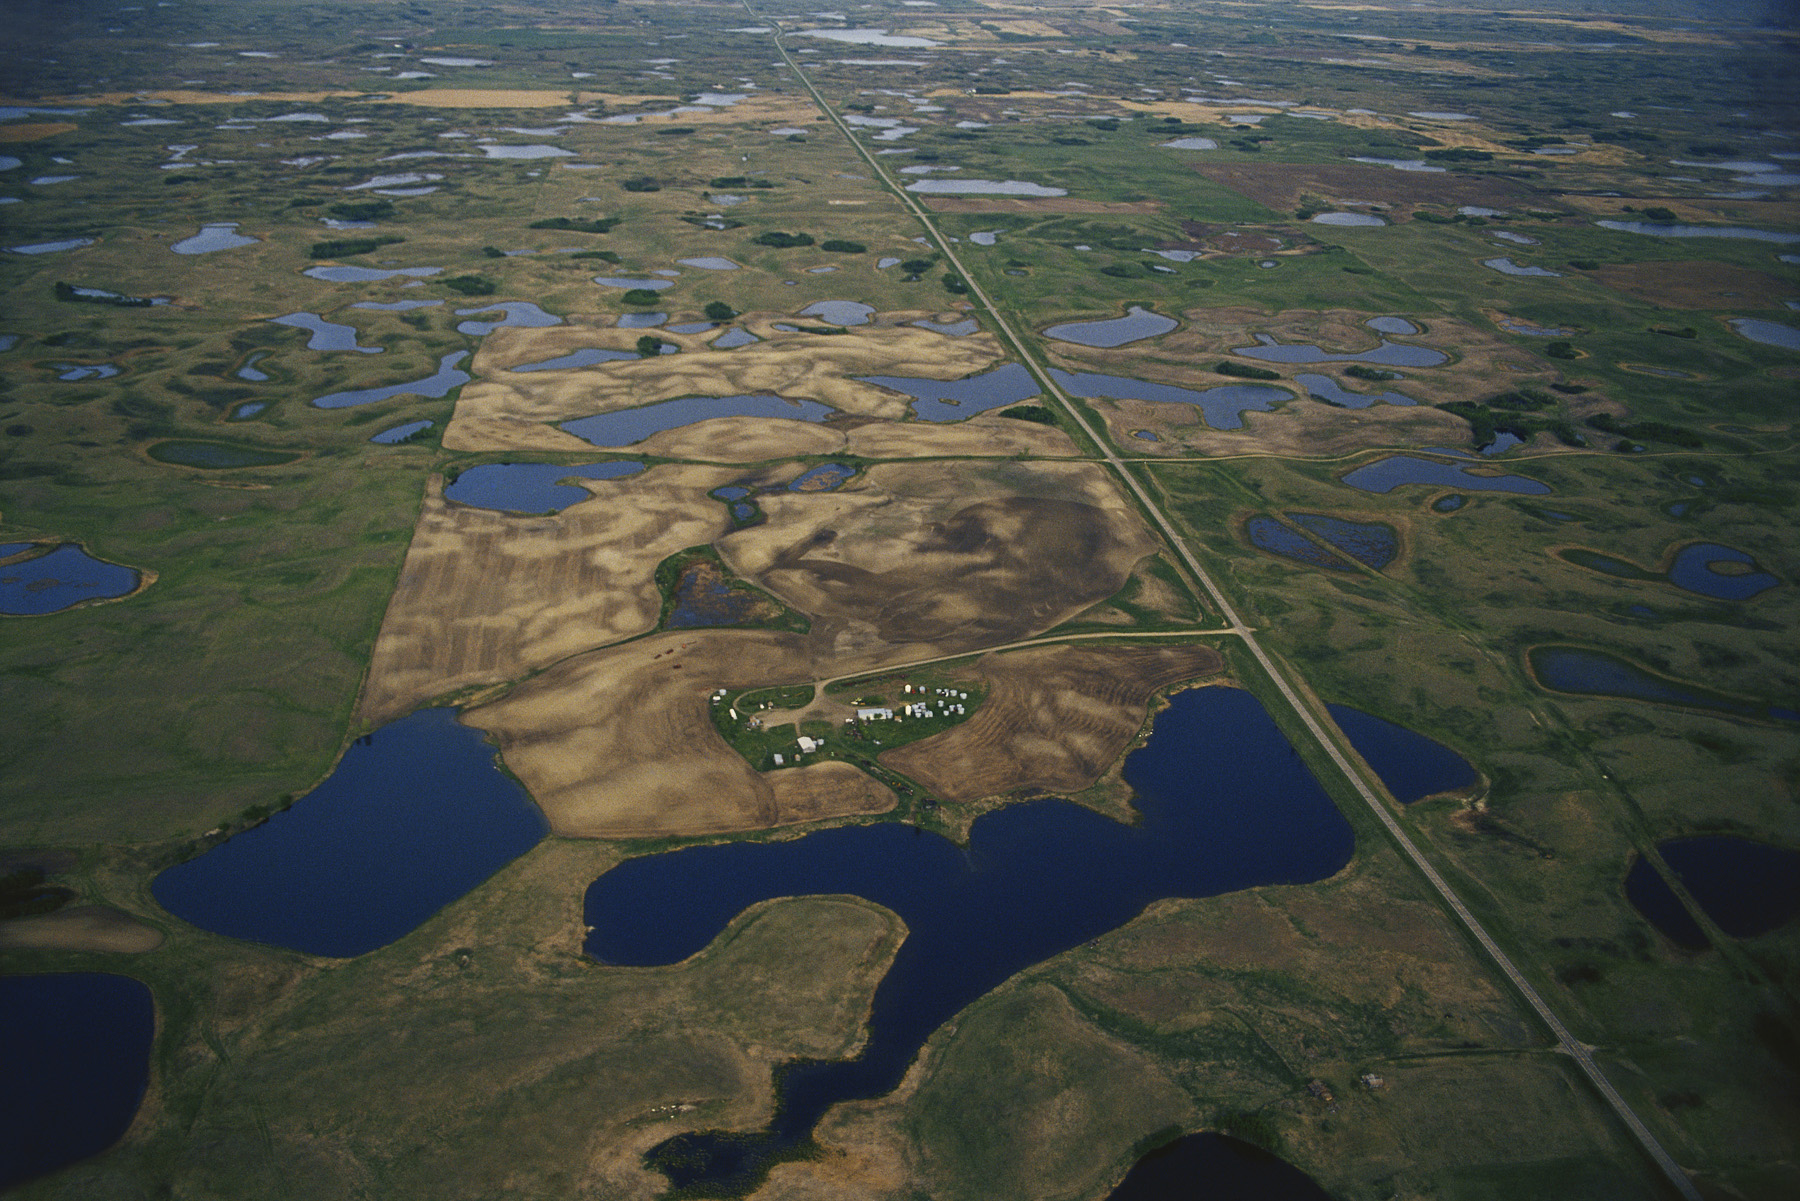
Metapopulations also occur as a result of human activities such as clearing forests, draining large wetlands, and constructing roads, housing developments, and commercial properties—all of which contribute to breaking up large habitats into a number of smaller habitats (Figure 13.17). Because the small habitats represent only fragments of the original, we refer to this process as habitat fragmentation. Small habitats typically support small populations, which, as we have seen, are prone to extinction. However, a group of small populations that are interconnected by occasional dispersal have a unique dynamic. While some habitat fragments experience extinctions of their subpopulations, others become colonized by dispersers that form new subpopulations. This combination of extinctions balanced by colonizations allows the metapopulation to persist over time.

Habitat fragmentation The process of breaking up large habitats into a number of smaller habitats.
In Chapter 11, we examined three different types of metapopulation models. The basic metapopulation model assumes that all habitat patches are equal in quality and that the habitat matrix between patches is inhospitable. The source–sink metapopulation model builds upon the basic model but incorporates the fact that habitat patches differ in quality. High-quality patches are known as sources because they produce high numbers of individuals that can disperse to other patches. In contrast, low-quality patches are known as sinks because they produce few individuals and rely on dispersers coming in from other patches to keep the subpopulation from going extinct. The landscape metapopulation model is even more realistic because it acknowledges that both the patches and the habitat matrix can vary in quality.
309
The dynamics of a metapopulation can fall along a range of possible outcomes. If the subpopulations rarely exchange individuals, the fluctuations in abundance will be independent among subpopulations. Some subpopulations will increase over a period of time while others will decrease or stay relatively constant. At the other extreme, if subpopulations are highly connected by individuals frequently moving among habitat patches, the subpopulations will act as one large population, with all experiencing the same fluctuations. Between these two extremes is the scenario in which individuals occasionally move between habitat patches, such as when juvenile animals disperse away from their family to find a mate. In this case, fluctuations in abundance in one subpopulation can influence the abundance of other subpopulations.
The Basic Model of Metapopulation Dynamics
Having reviewed the spatial structure of metapopulations, we can now examine the population dynamics that occur in metapopulations. We will start with the basic metapopulation model that contains a number of simplifying assumptions. Although these assumptions are not realistic, they can help us understand the basic dynamics of a metapopulation.
In this model, we begin with a population that is divided into several subpopulations, each occupying a distinct patch of habitat. We assume that these habitat patches are of equal quality, and that because each occupied patch has the same subpopulation size, each subpopulation supplies the same number of dispersers to other habitat patches.
For the entire collection of habitat patches that exist, we will assume that some fraction of them is occupied, which we denote as p. We will also assume that there is a fixed probability of each patch becoming unoccupied—that is, going extinct—in a given amount of time, which we shall refer to as e. Finally, we will assume that there is a fixed probability that each unoccupied patch could be colonized, which we will denote as c. Using these variables, the proportion of occupied patches when colonization and extinction achieve an equilibrium, as indicated by  , is given by the following equation:

This basic model indicates how we might increase the number of occupied habitat patches, which would increase the total number of individuals in the metapopulation given that each occupied patch is assumed to have an equal number of individuals. One way would be to provide corridors between neighboring populations, thereby increasing the rate of colonization, as we saw in the case of the collared lizards. A second way to increase the number of occupied habitat patches would be to decrease the rates of extinction by reducing the major causes of population decline in subpopulations.
The concept of the metapopulation is important for the conservation of species around the world as humans continue to fragment terrestrial and aquatic habitats. The models and empirical research inform us that a key to preserving populations is by maintaining large fragments of habitat whenever possible because populations in these large habitats are less likely to go extinct. When we can only preserve small fragments, we must ensure that individuals can disperse to and from them so they can be colonized, which will help prevent small, declining subpopulations from going extinct.
310
Observing Metapopulation Dynamics in Nature
The basic metapopulation model indicates that a metapopulation persists because of a balance between extinction of some habitat patches and colonization of others. Although these are the predictions of the model, we need to see if these processes occur in nature. One of the most extensive studies of metapopulations has been conducted on the Glanville fritillary butterfly (Melitaea cinxia) by ecologist Illka Hanski and colleagues. On the Åland Islands of Finland, this butterfly lives in isolated patches of dry meadows (Figure 13.18a). The researchers found 1,600 suitable meadows on the islands, but found that only 12 to 39 percent of these patches were occupied in any given year. Over a 9-year period, they observed that more than 100 of the occupied patches experienced extinction each year and more than 100 of the unoccupied patches experienced colonization. Based on their observations, it became clear to the researchers that no single patch was safe from extinction, but the metapopulation persisted because the extinctions were offset by continued colonizations.
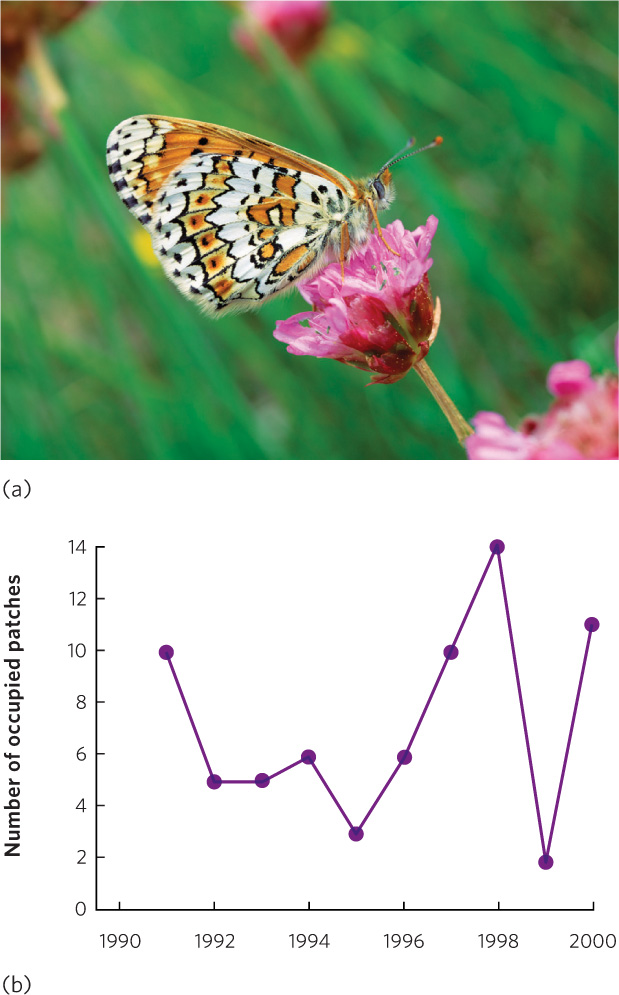
To closely examine extinctions and colonizations over time, Hanski and colleagues introduced populations of the Glanville fritillary to the small island of Sottungia off the coast of Finland. The island lacked this species of butterfly, but it contained 20 meadows that offered suitable butterfly habitat. The researchers introduced the Glanville fritillary to 10 meadows. They surveyed all 20 meadows for a decade to observe the dynamics of the metapopulation they had created. From their starting point of 10 subpopulations, they observed large fluctuations in the occupation of habitat patches over time, as shown in Figure 13.18b. During the course of their study, there were as few as 3 subpopulations and as many as 14 subpopulations. The number of extinctions ranged between 0 and 12 per year and the number of colonizations ranged between 0 and 9 per year. None of the original 10 subpopulations persisted for the entire decade. Instead, each subpopulation went extinct at different times and dispersers from other patches subsequently recolonized many of the habitat patches that experienced extinctions of their butterfly subpopulations. At the end of the decade-long experiment, the metapopulation consisted of 11 subpopulations, which is quite close to the original 10 subpopulations that were started at the beginning of the experiment. So, while there was a great deal of change going on at the subpopulation level, the metapopulation persisted.
The Importance of Patch Size and Patch Isolation
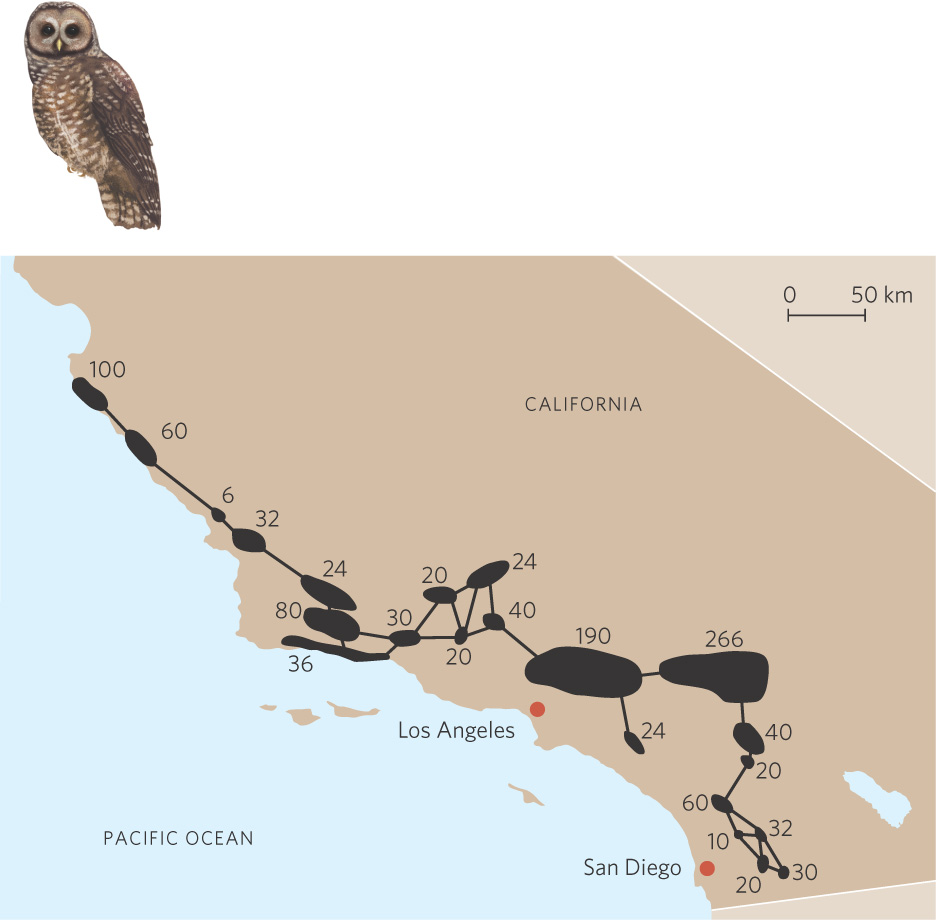
We have noted that the assumptions of the basic model of metapopulation dynamics do not allow for variations found in nature. For example, habitat patches are rarely equal in quality. Some patches are larger or contain a higher density of resources needed by a population. In Southern California, for example, the California spotted owl (Strix occidentalis occidentalis) lives along the coast in small habitat fragments. As you can see in Figure 13.19, these fragments are of very different sizes and the estimates of how many owls could be supported in each fragment ranges from 6 to 266. As you can also see, not all patches are equally distant from all other patches.
311
Rescue effect When dispersers supplement a declining subpopulation and thereby prevent the subpopulation from going extinct.
When each patch in a metapopulation supports a different number of individuals, we expect the small patches to experience higher rates of extinction. As a result, small patches are less likely to be occupied than large patches. At the same time, we might also predict that more distant patches will have a lower probability of being occupied than closer patches. We make this prediction because successful dispersal is a function of the distance an individual has to disperse. Therefore, unoccupied patches that are close to occupied patches have a better chance of colonization. Moreover, subpopulations on the brink of extinction can be supplemented by the arrival of dispersers from other subpopulations. When dispersers supplement a declining subpopulation and thereby prevent the subpopulation from going extinct, we call this phenomenon the rescue effect. These two mechanisms of colonization and the rescue effect should cause less isolated patches to experience a higher probability of being occupied in a metapopulation.
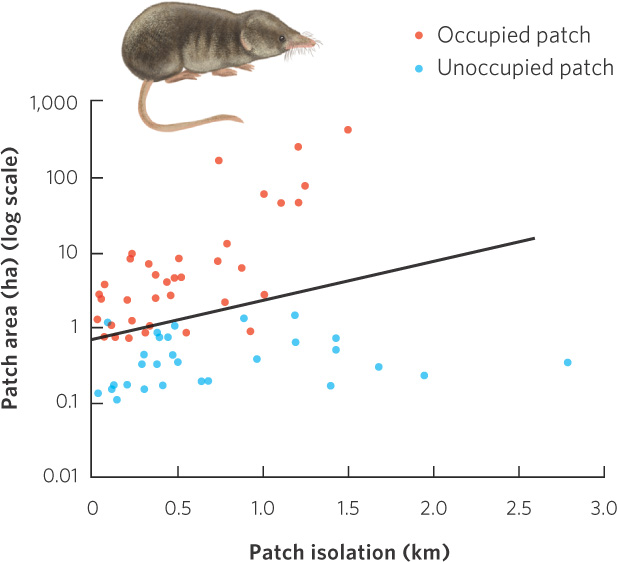
The effect of patch size and patch isolation on patch colonization has been tested using a series of islands in two lakes in Finland. Researchers surveyed a large number of islands to determine how many individuals of the common shrew (Sorex araneus) lived on each. The islands varied in size from about 0.1 to 1,000 ha, and they varied in isolation from less than 0.1 to more than 2 km from other islands or from the shore of the lake. The researchers evaluated their data in terms of patch size and patch isolation. As shown in Figure 13.20, they found that shrews were much less likely to occupy the smaller islands and those that were more isolated.
312
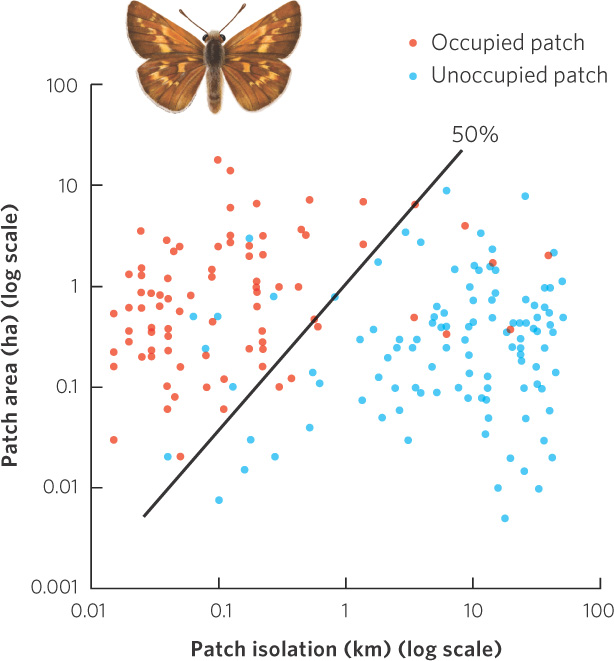
Similar patterns have been found in other species and other areas of the world. In Britain, for example, rabbits feed heavily on calcareous grasslands and the skipper butterflies (Hesperia comma) prefer to live in these heavily grazed areas. The grassland patches varied from about 0.01 to 10 ha in area and the distances between patches ranged from 0.02 to 100 km. The researchers examined which patches the butterflies occupied. Examining their data in Figure 13.21, you can see that the largest and least isolated patches were occupied whereas the smallest and most isolated patches were not occupied. As we will see in Chapter 22, patch size and isolation are not only important to the metapopulation of one species, but also to the total number of species that we find on habitat islands.
Throughout this chapter, we have examined how populations vary over time and space. Fluctuations over time are quite common in nature and some of these fluctuations exhibit cyclic patterns that are due to delayed density dependence. All populations have some chance of going extinct given enough time, but the smallest populations face a much higher risk of extinction due to demographic and environmental stochasticity. These population dynamics over time can be offset by population dynamics over space as observed in metapopulations in which habitat fragments can experience extinctions and colonizations over time in a manner that allows the entire metapopulation to persist over time. As we will see in “The Recovery of the Black-footed Ferret” below, understanding this interplay of population dynamics over time and space can be critical in bringing species back from the brink of extinction.
313
ECOLOGY TODAY CONNECTING THE CONCEPTS
THE RECOVERY OF THE BLACK-FOOTED FERRET
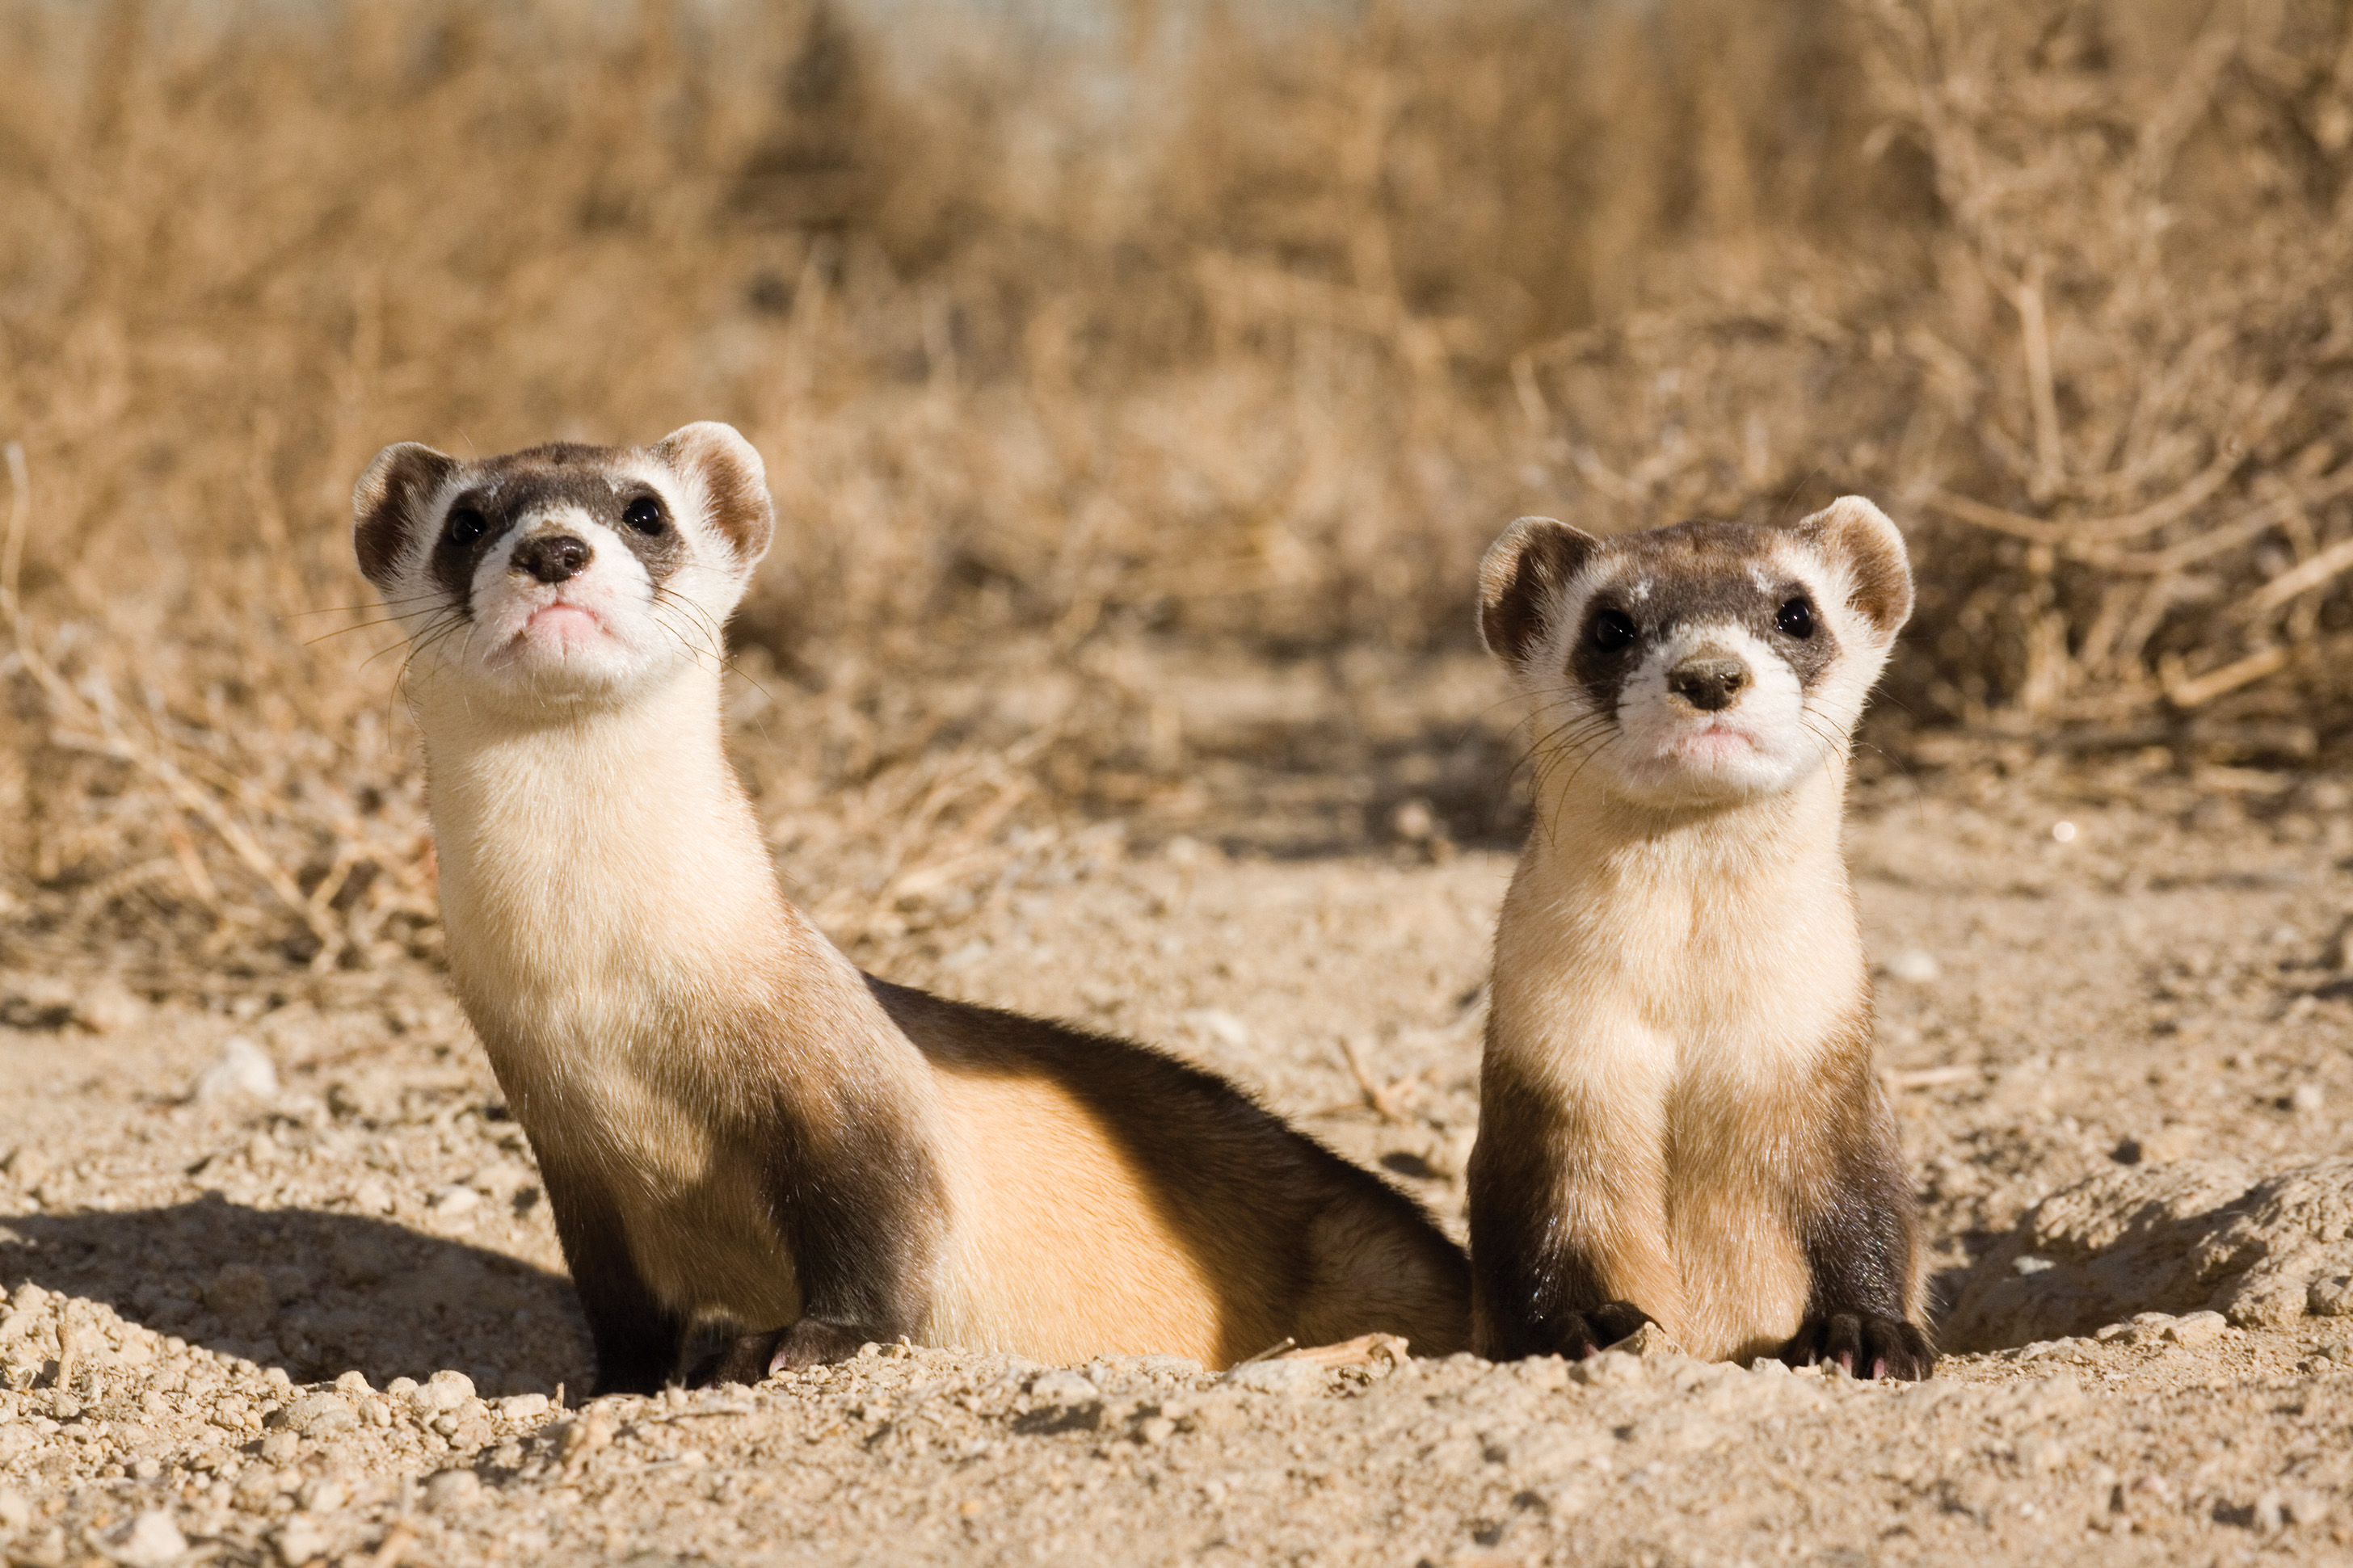
The black-footed ferret (Mustela nigripes) is an elusive animal of the American West. As a nocturnal predator and a member of the weasel family, it feeds almost entirely on prairie dogs. In fact, an average ferret can consume 125 to 150 prairie dogs per year. The ferret’s life is so tightly connected to prairie dogs that it lives in old prairie dog burrows within aggregations of prairie dogs known as “prairie dog towns.” Historically, the ferret is thought to have possessed a geographic range that spanned from Texas to Arizona and north all the way up to the Canadian border. No data exist on historic population sizes, but their numbers were probably in the tens of thousands and likely varied in relation to the fluctuating abundances of prairie dogs. By the 1980s, however, the ferret was thought to have gone extinct in the wild.
The decline of the black-footed ferret occurred over the course of more than a century. With settlement of the West in the 1800s, farmers converted a large portion of the land occupied by prairie dogs to cropland. This loss of habitat substantially reduced the carrying capacity of rangelands for prairie dogs, which in turn caused a large decline in the carrying capacity of ferrets. By the 1920s, a campaign of poisoning prairie dog towns was initiated to reduce the number of prairie dogs, which were thought to compete with cattle and sheep for rangeland plants. The poisons also killed the ferrets, but they also died from canine distemper and sylvatic plague. Canine distemper is a viral disease that is native to North America and deadly to members of the weasel family. Sylvatic plague is a disease introduced to North America from Asia in 1900 and is highly lethal to ferrets. A combination of habitat loss, poisoning, and disease caused prairie dog and ferret populations to decline rapidly.
The situation of the ferret started to receive attention in the 1960s when a single, small population was discovered in South Dakota. In a scramble to save the species from extinction, it was classified as an endangered species in 1967, which meant that efforts would be taken to promote the recovery of the species. Nine animals were brought into captivity for a breeding program. This initial attempt at captive breeding was not very successful; a few offspring were born but none survived beyond a few days. At the same time, the habitat at the South Dakota site continued to become more fragmented. As the ferret populations became smaller, the ferret faced a higher risk of extinction due to stochastic factors. Indeed, the small ferret population in nature went extinct in 1974 and the last ferret in captivity died in 1979. Everyone thought the ferret was extinct.
314
Two years later, a report that a rancher’s dog killed a ferret near the town of Meeteetse, Wyoming, led to the discovery of a population of more than 120 ferrets living in a nearby prairie dog town. However, in 1985, this population was infected by canine distemper and sylvatic plague and began a rapid decline. Because small populations are prone to extinction from stochastic factors, biologists captured the remaining 24 ferrets and brought them into a new captive breeding program in Wyoming. Although only 18 of the 24 ferrets survived, this time the captive breeding program was so successful that additional programs were started in other locations. These locations included several zoos to insure against a stochastic catastrophe at the Wyoming facility.
Within 6 years of bringing ferrets into captivity, biologists began to reintroduce animals into the wild where prairie dogs were abundant. By this time, because the concept of the metapopulation was much better understood, they chose to conduct several reintroductions throughout western North America. This strategy accounted for the possibility that should some subpopulations go extinct due to habitat loss, disease, or other stochastic factors, other subpopulations could persist and serve as future sources of new reintroductions. The recovery program has been an incredible success. Ferrets have been introduced to 19 sites throughout the United States, Canada, and Mexico and their number has grown from the original 18 animals that survived in captivity to more than 1,000 animals today. Its success reflects a tremendous effort by scientists working to identify and improve the factors that determine ferret population abundance over time and space.
SOURCES: Roelle, J. E., et al., eds. 2006, Recovery of the black-footed ferret—progress and continuing challenges: U.S.G.S. Scientific Investigations Report 2005–5293, 288 pp.
Robbins, J. 2008. Efforts on 2 fronts to save a population of ferrets.New York Times, July 15.
Black-footed ferret recovery program. http://blackfootedferret.org/