Graphing The Data: Time Series Data
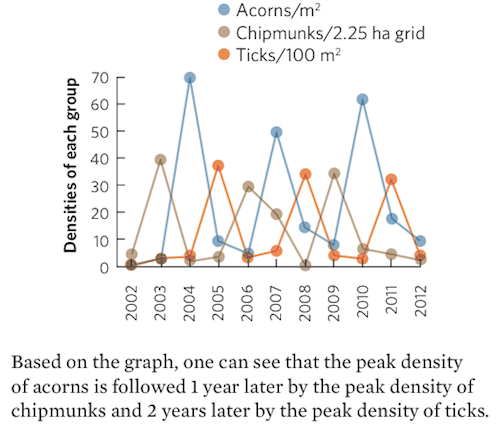
As we saw in “Ecology Today: Connecting the Concepts” at the end of this chapter, the number of black-legged ticks infected by the bacterium that causes Lyme disease is determined by the number of rodents, which in turn is affected by the production of acorns. In making these connections, researchers knew the abundance of the different species over time. Using the data provided in the table, plot the density of acorns, chipmunks, and ticks over time using a line graph.
Based on your graph, what patterns do you see in when changes in acorn density affect chipmunk density and when changes in chipmunk density affect tick density?
|
DENSITIES OF ACORNS, CHIPMUNKS, AND TICKS OVER TIME |
|||
|---|---|---|---|
|
YEAR |
ACORNS/m2 |
CHIPMUNKS 2.25 ha GRID |
TICKS/100 m2 |
|
2002 |
5 |
1 |
1 |
|
2003 |
40 |
3 |
4 |
|
2004 |
3 |
70 |
5 |
|
2005 |
4 |
10 |
38 |
|
2006 |
30 |
5 |
4 |
|
2007 |
20 |
50 |
7 |
|
2008 |
1 |
15 |
35 |
|
2009 |
35 |
8 |
5 |
|
2010 |
7 |
62 |
4 |
|
2011 |
5 |
18 |
33 |
|
2012 |
3 |
10 |
5 |