Graphing The Data: Competition for a Shared Resource
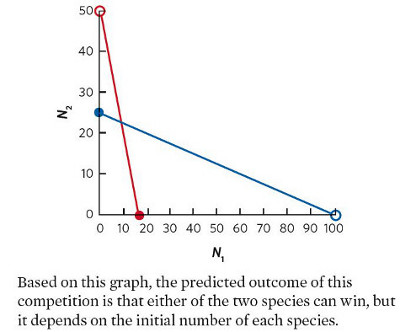
As we have seen in this chapter, we can understand the outcome of competition between two species for a common resource if we know something about the carrying capacity and competition coefficients of each species. Using the following data, graph the zero population growth isoclines for each species.
Species 1: K1 = 100, α = 0.4
Species 2: K2 = 50, β = 0.3
Based on your graph, what is the predicted outcome of competition between these two species?