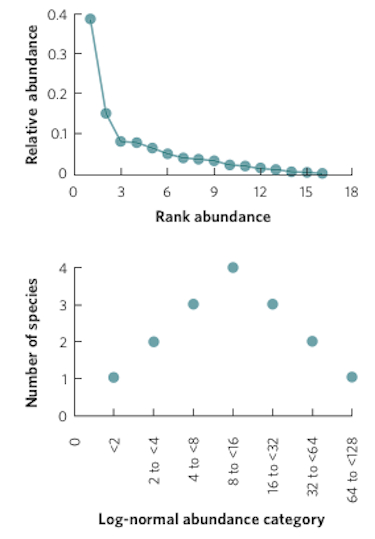
Graphing The Data: Log-Normal Distributions and Rank-Abundance Curves
You have been asked to assess the diversity of species in a grassland plot and you find 16 species that vary in relative abundance. Using the data in the table, create a rank-abundance curve and a log-normal distribution.
| SPECIES RANK | ABSOLUTE ABUNDANCE | RELATIVE ABUNDANCE | LOG-NORMAL CATEGORY |
|---|---|---|---|
| 1 | 308 | 0.385 | ≥128 |
| 2 | 121 | 0.151 | 64 to <128 |
| 3 | 65 | 0.081 | 64 to <128 |
| 4 | 62 | 0.078 | 32 to <64 |
| 5 | 51 | 0.064 | 32 to <64 |
| 6 | 41 | 0.051 | 32 to <64 |
| 7 | 31 | 0.039 | 16 to <32 |
| 8 | 30 | 0.038 | 16 to <32 |
| 9 | 27 | 0.034 | 16 to <32 |
| 10 | 18 | 0.023 | 16 to <32 |
| 11 | 15 | 0.019 | 4 to <8 |
| 12 | 13 | 0.016 | 4 to <8 |
| 13 | 8 | 0.010 | 4 to <8 |
| 14 | 5 | 0.006 | 2 to <4 |
| 15 | 4 | 0.005 | 2 to <4 |
| 16 | 1 | 0.001 | <2 |
| TOTAL= | 800 |