Graphing The Data: Species Richness at Glacier Bay
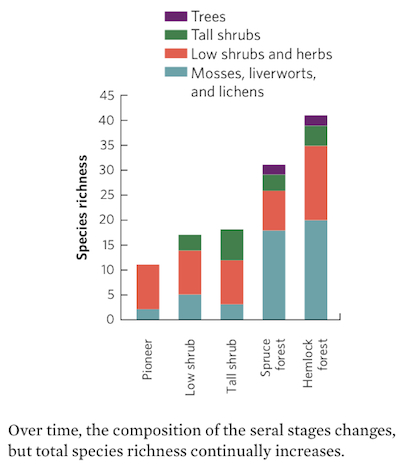
We typically think of succession as a series of different species dominating a site over time. Ecologist William Reiners and his colleagues visited Glacier Bay sites that had been exposed by the retreating glacier at different times. They quantified the species richness for each of five types of vegetation. Using their data in the table, create a stacked bar graph that shows the species richness for each of the five types of vegetation at a given seral stage.
Based on this graph, what happens to total species richness of the Glacier Bay sites as succession proceeds?
| SUCCESSIONAL STAGE | MOSSES, LIVERWORTS, AND LICHENS | LOW SHRUBS AND HERBS | TALL SHRUBS | TREES |
|---|---|---|---|---|
| PIONEER | 2 | 9 | 0 | 0 |
| LOW SHRUB | 5 | 9 | 3 | 0 |
| TALL SHRUB | 3 | 9 | 6 | 0 |
| SPRUCE FOREST | 18 | 8 | 3 | 2 |
| HEMLOCK FOREST | 20 | 15 | 4 | 2 |

SOURCE: Data from Reiners, W., et al. 1971. Plant diversity in a chronosequence at Glacier Bay, Alaska. Ecology 52: 55–69.