Scientists use several approaches to studying ecology
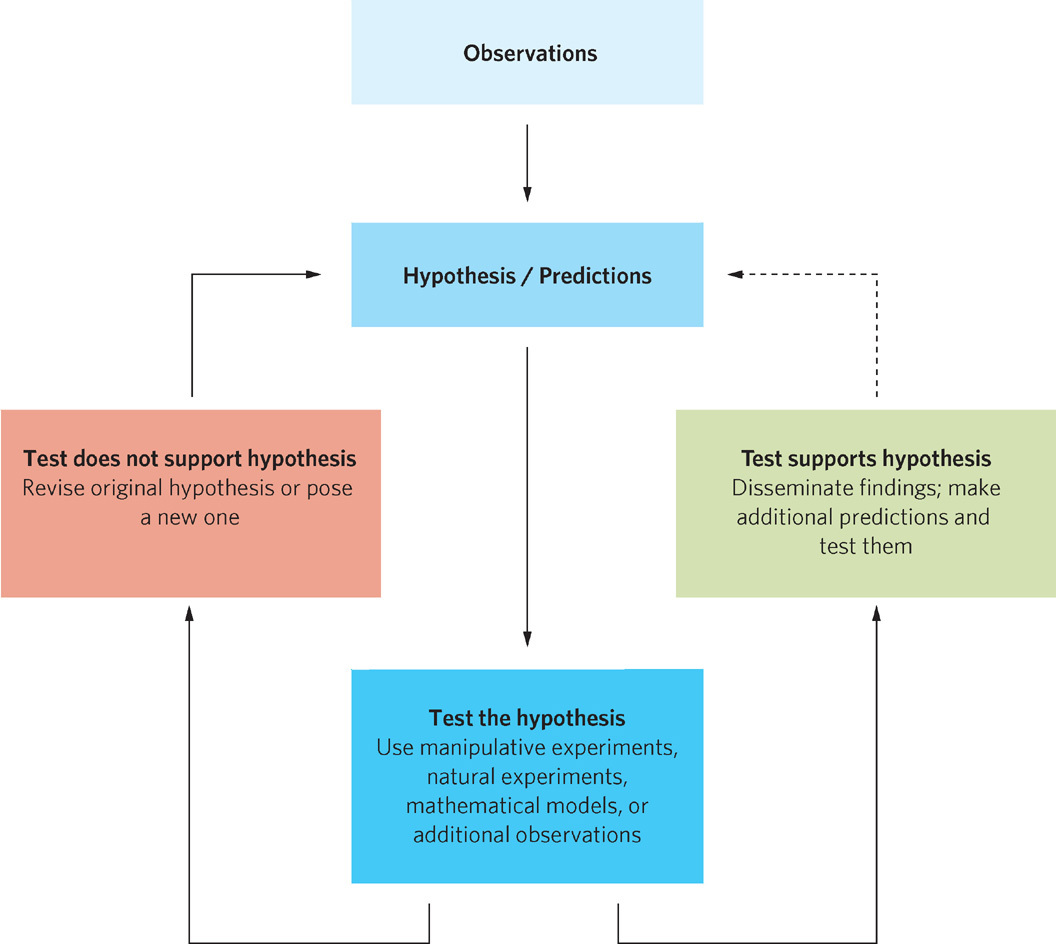
Scientists have investigated the diverse roles that organisms play in the environment for more than a century. Ecologists investigate their subject matter using a systematic procedure, often referred to as the scientific method. The three steps of this process, shown in Figure 1.16, are (1) observations regarding a pattern in nature, (2) development of a hypothesis, and (3) testing the hypothesis.
Observations, Hypotheses, and Predictions
Most research begins with a set of observations about nature that invite explanation. Usually these observations identify and describe a consistent pattern. As we learned in the history of research on the deep-sea vents, once it was discovered that the diversity and abundance of species living around the vents could not be sustained by the relatively small amount of organic matter drifting down from the sunlit surface, new hypotheses regarding chemosynthetic bacteria had to be developed and tested. In such cases, some hypotheses will be supported, while others will be rejected and require new hypotheses. This process is the scientific method.
To help you better understand the scientific method, imagine that you are walking around a pond on a warm, spring night following a rainstorm. You would likely hear male frogs making frog calls. If you returned to the same pond on cooler nights following a dry period, you would be less likely to hear frogs calling. If you traveled to many different ponds, you would observe this pattern over and over again. That is, you would observe and describe a consistent pattern in nature. Repeated natural patterns lead scientists to hypothesize about the causes of these patterns.
21
Hypothesis An idea that potentially explains a repeated observation.
Hypotheses are ideas that potentially explain a repeated observation. In the case of the frogs, we consistently observed that they called only on warm nights after a rainstorm. Having established the existence of this pattern, we want to understand it better. We might want to explain how frogs sense changes in temperature and rainfall, and how sensing these environmental changes stimulates frogs to call. We also might want to explain why frogs call on warm nights after it rains. How do the frogs benefit from calling—perhaps by attracting mates—and what, if any, are the costs of calling?
Hypotheses about how and why organisms respond to the environment represent different types of explanations. The “how” explanation addresses the details of the animal’s sensory perception and changes in its hormone concentrations, nervous system, and muscular system. In the case of the frogs, we might hypothesize that the frog’s nervous system detects warm temperatures and rain. This initiates changes in a male frog’s hormones and physiology that cause him to contract muscles that make him call.
Proximate hypothesis A hypothesis that addresses the immediate changes in an organism’s hormones, physiology, nervous system, or muscular system.
Hypotheses that address the immediate changes in an organism’s hormones, physiology, nervous system, or muscular system are known as proximate hypotheses. If these hypotheses are correct, then we can make predictions. Predictions are statements that arise logically from hypotheses. For example, if our hypothesis about how a rainy night causes male frogs to call is correct, then we can predict that any frogs exposed to warm rain will respond by changing the concentration of specific hormones that stimulate the brain to send a signal to the muscles of the vocal apparatus to contract.
Prediction A logical consequence of a hypothesis.
Ultimate hypothesis A hypothesis that addresses why an organism responds in a certain way to its environment in terms of the fitness costs and benefits of the response.
Ultimate hypotheses address why an organism responds in a certain way to its environment—that is, the fitness costs and benefits of a particular response. For example, we might hypothesize that male frogs call to attract females. Furthermore, if we suspect that male frogs call to attract females, then perhaps males sing on warm nights after a rainstorm because such nights produce the best conditions for laying eggs, which is when females are most interested in mating. The males benefit from calling on a warm, wet night because they will be more likely to attract females and therefore father more offspring. If the males call at other times, they will attract fewer female mates and receive a much smaller benefit. But what about costs? We might hypothesize that when male frogs call to attract females, they risk attracting the attention of predators. The increased risk of death represents a high fitness cost to male frogs.
We have now generated a number of predictions that logically follow from our ultimate hypotheses about male frog calling: (1) males that call will attract females; (2) females actively search for males only on warm, wet nights; (3) if singing imposes a cost, then males should save their singing for times when it will provide the greatest benefit.
Testing Hypotheses With Manipulative Experiments
Manipulative experiment A process by which a hypothesis is tested by altering a factor that is hypothesized to be an underlying cause of the phenomenon.
A particular hypothesis can rarely be confirmed beyond a doubt. However, our confidence increases as we continue testing a hypothesis and repeatedly find that our observations support it. Although the methods of acquiring scientific knowledge appear to be straightforward, many pitfalls exist. For example, an observed relationship between two factors does not necessarily mean that one factor causes the other to change. The cause must be determined independently. To accomplish this, we can design manipulative experiments in which a hypothesis is tested by altering a factor that is hypothesized to be an underlying cause of the phenomenon.
To understand the process of a manipulative experiment, consider the observation that herbivorous insects often consume less than 10 percent of a plant’s tissues. Ecologists have proposed several hypotheses to explain this. One is that predators consume insect herbivores at such a high rate that insect populations remain low. This low insect population cannot eat very much of the plant tissue. This seems like a reasonable hypothesis, but how do we test it with a manipulative experiment?
Researchers working on this question decided to explore whether the predation hypothesis applies to insects feeding on oak trees in Missouri. They observed that birds consume many insects on oak leaves and then hypothesized that birds reduce the populations of insect herbivores. If this hypothesis were correct, when birds are absent, insect populations would increase and consume more leaf biomass. Confirmation of this prediction would support their hypothesis; a lack of confirmation would lead them to reject the hypothesis and propose a new one.
22
To test the hypothesis that predation by birds lowers the abundance of insects on oak trees, the researchers decided to conduct a manipulative experiment in which they used cages that excluded birds from the trees (Figure 1.17a). The manipulation, also known as the treatment, is the factor that we want to vary in an experiment. Often one of the manipulations used is a control. A control is a manipulation that includes all aspects of an experiment except the factor of interest. In the oak tree experiment, the caged trees served as the treatment whereas the uncaged trees served as the control.

Manipulation The factor that we want to vary in an experiment. Also known as Treatment.
Control A manipulation that includes all aspects of an experiment except the factor of interest.
Experimental unit The object to which we apply an experimental manipulation.
Once we decide on which manipulations we wish to do, we have to assign each manipulation to a specific experimental unit. An experimental unit is the object to which we apply the manipulation. In the case of the oak tree experiment, the researchers decided that they would use groups of three white oak saplings as their experimental units. After making this decision, each experimental unit was either caged—by surrounding the group of three saplings with bird-proof netting—or left uncaged to allow bird access.
Replication Being able to produce a similar outcome multiple times.
A manipulation to a single experimental unit might provide exciting results, but the results may not be reliable unless the experiment is repeated and demonstrates a similar outcome. Being able to produce a similar outcome multiple times is known as replication, which is an integral feature of most experimental studies. In the oak tree study, the investigators decided to add cages to 10 groups of trees and leave 10 groups of trees uncaged. In doing so, they replicated their experiment 10 times.
Randomization An aspect of experiment design in which every experimental unit has an equal chance of being assigned to a particular manipulation.
When we assign different manipulations to our experimental units, the assignments must be made using randomization, which means that every experimental unit has an equal chance of being assigned a particular manipulation. In the oak tree experiment, the researchers randomly assigned groups of trees to be caged or left uncaged as controls. In this way, they could be assured that the caged trees were initially no different from the controls.
Once the researchers set up the experiment, they collected data on the number of herbivorous insects and the percentage of leaf tissue that had been consumed. They found that caged trees had about twice as many insect herbivores as the control trees. Moreover, the percentage of leaf tissue consumed at the end of the growing season was nearly twice as high on caged trees as on the control trees (Figure 1.17b). These findings led the researchers to conclude that the experiment supported their hypothesis.
Although many experiments are conducted in natural settings such as oak forests or lakes, other experiments are conducted at smaller scales (Figure 1.18). Many experiments make use of microcosms, which are simplified ecological systems that attempt to replicate the essential features of an ecological system in a laboratory or field setting. In the case of experiments that study aquatic systems, for example, microcosms might consist of large outdoor tanks of water. These tanks would include many of the features of natural water bodies, including soil, vegetation, and a diversity of organisms (Figure 1.18b). The use of microcosms assumes that a response to manipulations in a microcosm is representative of responses that would occur in a natural habitat. For example, we might wish to understand how species of fish compete for food. Observing competition among the fish species in a murky lake might not be feasible, but a large tank of water that included many features of the lake might work well, providing that the fish behave similarly under both conditions. If so, the results of the microcosm experiment may yield results that can be generalized to the larger, natural system.

Microcosm A simplified ecological system that attempts to replicate the essential features of an ecological system in a laboratory or field setting.
23
Alternative Approaches To Manipulative Experiments
Many hypotheses cannot be tested by experiments, either because the amount of area or length of time needed to test the hypotheses is simply too large, or because it is not possible to isolate particular variables and devise a suitable control. These limitations are common when we are trying to understand patterns that have occurred over long periods, or in systems such as entire populations or ecosystems that are too large to be manipulated.
Several different hypotheses might explain a particular observation equally well, so investigators must make predictions that distinguish among the alternatives. For example, many ecologists have observed a decrease in the number of species as one moves north or south, away from the equator. This repeated pattern has many potential explanations. As one travels north from the equator, average temperature and precipitation decrease, sunlight decreases, and seasonality increases. Each of these factors alone or together could affect the number of species that can coexist in a specific locality. Indeed, dozens of hypotheses have been proposed to explain the observed decrease in the number of species as one moves away from the equator. Isolating the effect of each factor has proved difficult because all of the other factors for which we might construct a hypothesis change together.
24
ANALYZING ECOLOGY
Why Do We Calculate Means and Variances?
Observations Information, including measurements, that is collected from organisms or the environment. Also known as Data.
As we saw in the oak tree experiment, when testing hypotheses ecologists make observations, which can be thought of as information, including measurements that are collected from organisms or the environment. These observations, also known as data, are then used to test hypotheses. In the case of the oak trees, the researchers collected data on the density of herbivorous insects and the amount of leaf tissue they consumed.
In asking questions in ecology, we often want to know the average value, or mean, of the data collected from different treatments or obtained under different conditions. In the case of the oak tree experiment, the researchers wanted to compare the mean density of insects in caged trees versus uncaged trees to determine whether birds depressed the numbers of insects consuming the tree leaves.
While a comparison of the different means tells us about the central tendencies of the data, ecologists often want to know if the data used to generate the mean have high or low variability. For example, if the mean density of insects on leaves was 10 insects per square meter of leaf surface in both of the following sets of data, which group is more variable?
Group A: 10, 9, 11, 10, 8, 12, 9, 11, 8, 12
Group B: 10, 5, 15, 10, 6, 14, 5, 15, 7, 13
Although both groups of data have the same mean, observations in Group A range from 8 to 12 whereas in Group B they range from 5 to 15. Therefore, the data in Group B are more variable.
Why do we care about the variability of the data that we collect? Given that each mean is calculated from a set of data that has either a narrow or a wide range, the variability gives us an idea of how much the distributions of data overlap with each other. If two groups of data have different means but the distributions of data overlap a great deal, then we cannot be confident that the two groups are actually different from each other. In contrast, if two groups of data have different means but the distributions of data do not overlap, then we might be very confident that the two groups are different.
Variance of the mean A measurement that indicates the spread of the data around the mean of a population when every member of the population has been measured.
One way to measure how widely the data points are spread around the mean is to calculate the variance of the mean. The variance of the mean is a measurement that indicates the spread of data around the mean of a population when every member of the population has been measured. Data points that are more widely spread around the mean will have a higher variance.
The easiest way to calculate the variance in a set of data (denoted as σ2) is to do it in two steps:
- 1. Square each observed value (denoted as χ) and calculate the mean of these squared values (where E indicates that we are taking the mean of several values): E[χ2]
- 2. From this mean, subtract the square of the mean observed value: σ2 = E[χ2] − [E(χ)]2
In words, E[χ2] is the mean of the squared observed values and [E(χ)]2 is the square of the mean observed value.
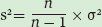
When we calculate the variance of the mean, the calculation is based on the assumption that we have measured every member of a population. In reality, we often cannot measure every member, but instead measure a sample of the population. In the oak tree study, for example, the researchers did not measure the insects on all of the oak trees, but instead used a sample of 10 groups of oak trees. When we measure a sample of the population, the variation in the data is called the sample variance. The sample variance is very similar to the variance of the mean, except that we now account for how many samples of the population we measured (denoted as n). The sample variance (denoted as s2) is calculated as:
or
Sample variance A measurement that indicates the spread of the data around the mean of a population when only a sample of the population has been measured.

As you might notice from this equation, as the number of samples becomes very large, the value of the sample variance approaches the value of the variance of the mean for the entire population.
To help you understand how to calculate the sample variance, consider the following set of observations on the abundance of insects per leaf on caged and uncaged trees:

For the caged trees, we can calculate the mean of the values as:
(8 + 6 + 7 + 9 + 5) ÷ 5 = 7
and the mean of the squared values as:
(82 + 62 + 72 + 92 + 52) ÷ 5 = 51
We can then calculate the sample variance for the caged-tree data as:


Insect abundance on uncaged trees:
Mean = 3.0
Variance = 1.0
Natural experiment An approach to hypothesis testing that relies on natural variation in the environment.
Ecologists have several alternative approaches that address these difficulties. One option, the natural experiment, relies on natural variation in the environment to test a hypothesis. For example, consider the hypothesis that the number of species on an island is influenced by the size of the island because larger islands have more available niches, support larger populations that resist extinction, and are easier for organisms to find and colonize. A manipulative experiment to test this hypothesis would be impossible since it would require both a massive manipulation of many islands as well as the ability to observe a difference in the number of colonizing species over hundreds or even thousands of years. Instead, we can “test” the hypothesis by comparing the number of species living on islands of different sizes that have been created over shorter periods by changes in sea or lake levels. Although a manipulative experiment is not possible in such cases, a natural experiment like this still allows researchers to determine if patterns in nature are consistent or inconsistent with hypotheses about the underlying causes.
25
Mathematical model A representation of a system with a set of equations that correspond to hypothesized relationships among the system’s components.
Ecologists also use mathematical models to explore the behavior of ecological systems. In a mathematical model, an investigator designs a representation of a system with a set of equations that corresponds to the hypothesized relationships among each of the system’s components. For example, we might use a mathematical model to represent how births and immigration add to the growth rate of a population, and how deaths and emigration subtract from that growth rate. In this sense, a mathematical model is a hypothesis; it provides an explanation of the observed structure and functioning of the system.
We can test the accuracy of a mathematical model by comparing the predictions it yields with observations in nature. For example, epidemiologists have developed models to describe the spread of communicable diseases. These models include such factors as the proportions of a population that are susceptible, exposed, infected, and recovered from infections. The models also include the rates of transmission and the probability that the organism will cause a disease in an infected organism. By including all of these factors, such models can make predictions about the frequency and severity of disease outbreaks. These predictions can then be tested by comparing them with real-world observations of disease outbreaks. This approach is being used for a number of important wildlife diseases, including the transmission of rabies in such animals as bats, raccoons, skunks, and foxes, and the transmission of Lyme disease in wildlife and human populations.
26
Mathematical models can be used on any scale. For example, at a larger scale, ecologists have created mathematical models to investigate how burning fossil fuels affects the CO2 content of the atmosphere. To manage human impacts on our environment, it is critically important to understand this relationship. Models of global carbon content include, among other factors, equations that describe the uptake of CO2 by plants and the dissolution of CO2 in the oceans. The earlier versions of these models failed to match observations and overestimated the annual increase in atmospheric CO2 concentrations. The real world evidently contains CO2 “sinks” such as regenerating forests that remove CO2 from the atmosphere. By including the effects of these CO2 sinks, the refined carbon models more accurately describe observed atmospheric data and are more likely to predict future changes accurately.
For any model, we can support or reject the hypothesis by comparing the model’s predictions against our observations. Rejected models can be further refined to incorporate additional complexities and better fit our observations.