Primary productivity provides energy to the ecosystem
The vast majority of all energy that moves through ecosystems originates as solar energy that powers the photosynthesis of producers. As we saw in Chapter 1, some communities—such as those that form around thermal vents in the deep ocean—rely on chemosynthesis as their source of energy. Regardless of origin, producers harness energy and form the basis of food webs. Producers use this energy for respiration, growth, and reproduction; the amount used for growth and reproduction represents the energy that is available to consumers. In this section, we will examine how ecologists quantify the amount of energy that producers use for different functions, how researchers make these measurements in different types of ecosystems, and how the amount of energy available in producers affects the growth and reproduction of consumers.
Primary Productivity
Primary productivity is the rate at which solar or chemical energy is captured and converted into chemical bonds by photosynthesis or chemosynthesis. Primary productivity tells us how much energy is available in an ecosystem. A related concept is the standing crop of an ecosystem, which is the biomass of producers present in the ecosystem at a given area at a particular moment in time. For example, the standing crop of a forest is the total mass of trees, shrubs, herbs, and grasses that is present in an area of the forest on a particular day. Ecosystems with high primary productivity may or may not have a high standing mass. In lakes where algae experience high productivity, consumers may eat it nearly as quickly as it grows, and so the standing crop of algae will remain low.
Primary productivity The rate at which solar or chemical energy is captured and converted into chemical bonds by photosynthesis or chemosynthesis.
469
Standing crop The biomass of producers present in a given area of an ecosystem at a particular moment in time.
Ecologists identify two types of primary productivity: gross primary productivity and net primary productivity. Gross primary productivity (GPP) is the rate at which energy is captured and assimilated by producers in an area. We often express productivity in units of Joules (J) or kilo Joules (kJ) per square meter per year. From this total, producers use some of the assimilated energy for their own metabolism, which is measured in terms of the amount of respiration by the producers. The rest of the assimilated energy is converted into producer biomass that includes growth and reproduction. The rate of energy that is assimilated by producers and converted into producer biomass in an area is net primary productivity (NPP). We can also show this in the form of an equation:
Gross primary productivity (GPP) The rate at which energy is captured and assimilated by producers in an area.
NPP = GPP − Respiration
Net primary productivity (NPP) The rate of energy that is assimilated by producers and converted into producer biomass in an area.
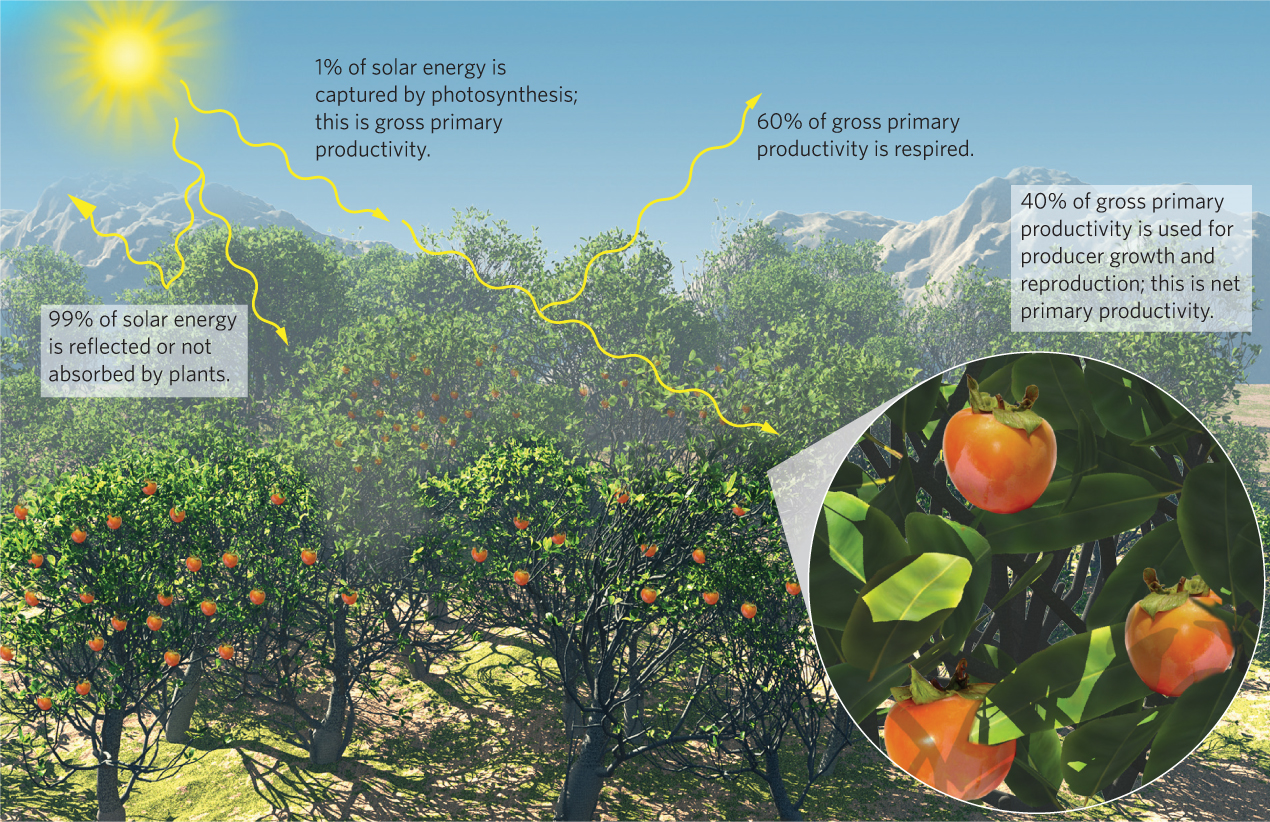
Considering the rate at which the Sun provides energy, photosynthesis is not a very efficient process. As illustrated in Figure 20.1, approximately 99 percent of all solar energy that is available to producers either reflects off them or passes through their tissues without being absorbed. Of the 1 percent of the solar energy that producers absorb and use for photosynthesis—that is, gross primary productivity—approximately 60 percent is used for respiration. This means that only 40 percent of absorbed solar energy is used for net primary productivity—the growth and reproduction of producers. For example, if we measure the productivity of a forest in North America in units of kilograms of carbon per square meter per year, such a forest might have a GPP of 2.5 kg C/m2/year. Of this total, the forest will use about 1.5 kg C/m2/year for respiration, leaving 1.0 kg C/m2/year for growth and reproduction, which represents the forest’s NPP.
470
Measuring Primary Productivity
Primary productivity is the foundation for the flow of energy through food webs and ecosystems. Being able to measure primary productivity allows us to track how it changes in an ecosystem over time and how it varies in different ecosystems around the globe. Since primary productivity is a rate, we can measure it by quantifying the change in the biomass of producers over time, the movement of carbon dioxide over time, or the movement of oxygen over time. In terrestrial ecosystems, we commonly measure the productivity of plants, but in aquatic systems we might measure the productivity of plants, large kelp, or tiny species of algae. As we will see, the choice of how to measure primary productivity depends on the particular ecosystem being studied.
When measuring primary productivity, it is critical to determine whether our measurements represent gross or net primary productivity. In some cases we can measure net primary productivity and respiration separately and then use these values to estimate gross primary productivity. We will now discuss a variety of common methods for measuring primary productivity in both terrestrial and aquatic ecosystems.
Measuring Changes in Producer Biomass
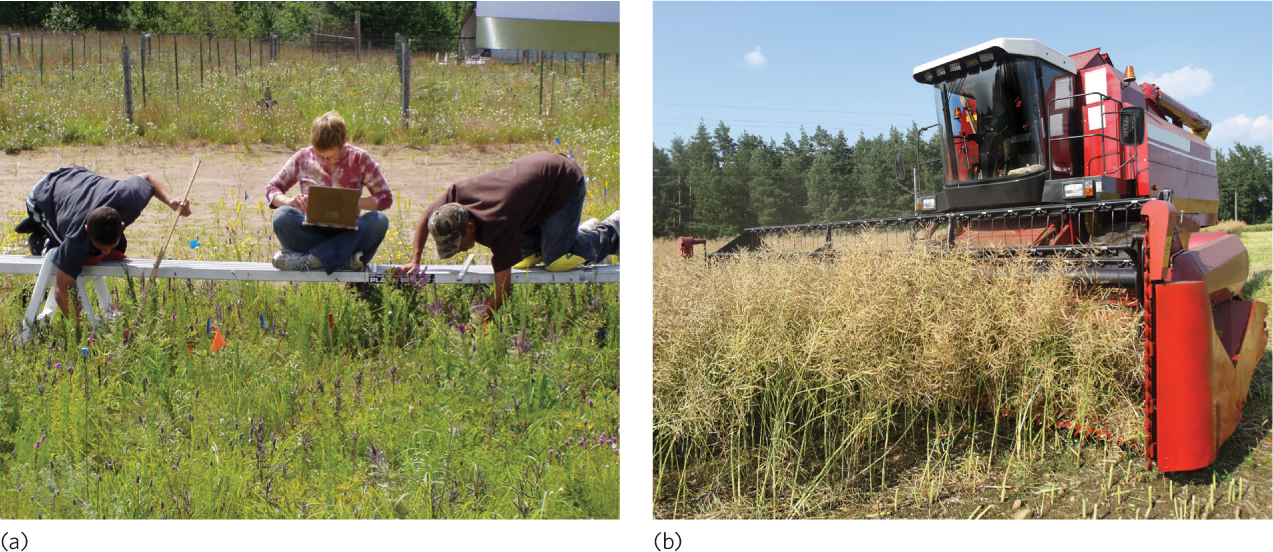
One of the simplest ways to measure NPP is by measuring producer biomass in an area at the beginning and at the end of a growing season (Figure 20.2). For example, in prairie ecosystems researchers commonly measure the amount of new plant growth that has accumulated by the end of the summer growing season, while in aquatic ecosystems, ecologists measure the biomass of large aquatic producers such as kelps. Researchers can harvest a season’s growth, let it dry, and then weigh it to determine how much growth occurred during the season. When scientists measure a harvest to determine biomass, they either assume that no substantial herbivory or tissue mortality has occurred during the period of producer growth or they estimate the amount of biomass lost to these two processes and include this amount in the estimate of net primary productivity.
When we harvest, dry, and weigh plants from aquatic or terrestrial ecosystems, researchers may only harvest the part of the plant that lives aboveground. However, the amount of biomass belowground for some plants can be substantial. For example, perennial grasses with extensive root systems have twice as much belowground biomass as aboveground biomass. In contrast, most trees have about five times more aboveground biomass than belowground biomass.
471
Measuring underground biomass is quite a challenge. Retrieving the rhizomes, tubers, and roots of plants from the terrestrial soils or the aquatic benthos is often not feasible because they are either very deep or the root systems are composed of many fine roots that break off when harvested. In many plants, these fine roots die and are replaced with new fine roots, which makes it difficult to estimate how much biomass a group of producers has accumulated. It is also difficult to account for plants in mutualistic relationships with mycorrhizal fungi. These plants may send carbohydrates to the fungi, but because these carbohydrates are no longer a part of the plant, it is hard to get an accurate estimate of the plant’s productivity. Therefore, we have to be cautious when making conclusions about differences in productivity when we measure only changes in the aboveground biomass to estimate net primary productivity.
Measuring CO₂ Uptake and Release
Because producers take up CO2 during photosynthesis and produce CO2 during respiration, we can measure primary productivity in terrestrial ecosystems by quantifying the uptake and release of CO2 by plant leaves. One way to measure these changes in CO2 is by placing a small plant or a leaf into a sealed container with a highly sensitive CO2 sensor, as illustrated in Figure 20.3. When the container is placed in front of a light that simulates sunlight, the plant consumes CO2 as it conducts photosynthesis and produces carbohydrates. The plant simultaneously produces CO2 as it metabolizes some of its carbohydrates through respiration. Since CO2 uptake from photosynthesis exceeds CO2 release from respiration, the net uptake of CO2 represents net primary productivity.
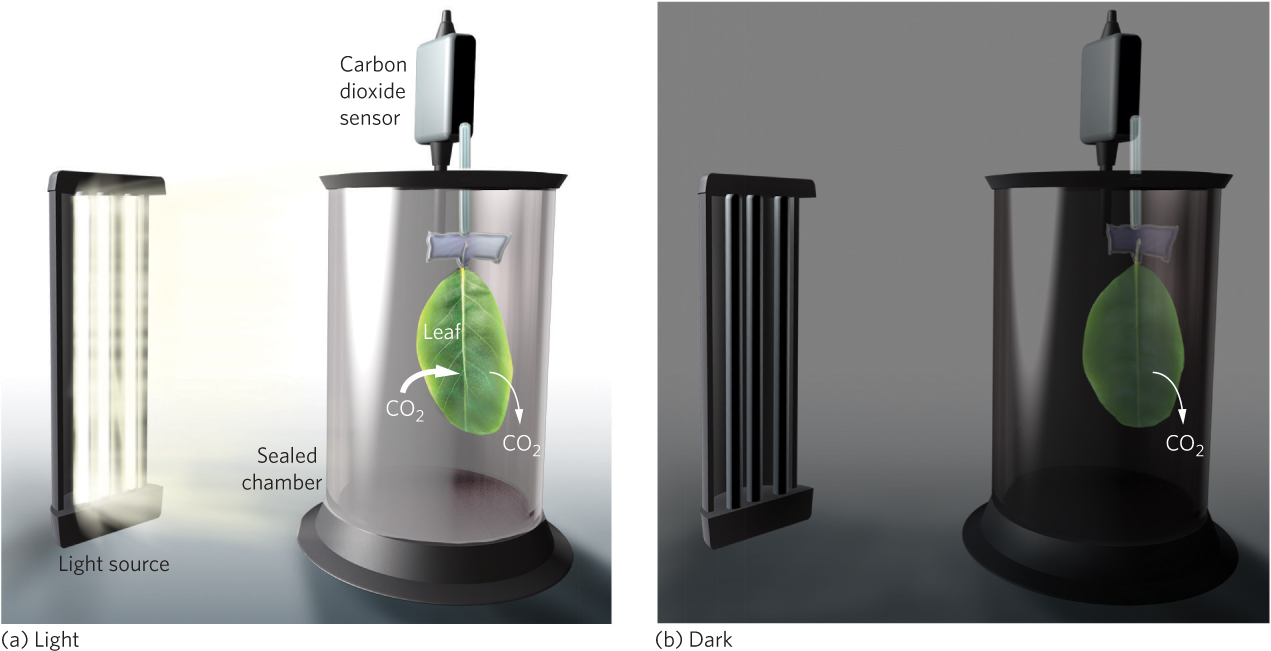
We can also estimate GPP using this technique. Since GPP is the sum of net primary productivity and respiration, we can determine GPP by combining our estimate of NPP with an estimate of how much respiration is occurring in a plant. We can do this by placing leaves or whole plants in chambers without sunlight. If we measure the plant’s rate of respiration in the dark and add it to the plant’s NPP, we can estimate the gross primary productivity using the following rearranged equation:
GPP = NPP + Respiration
Because these experiments are conducted using some chambers placed in the light and other chambers placed in the dark, they are sometimes referred to as a light-dark bottle experiment.
472
Several other techniques can also be used to measure CO2 uptake and release. For example, researchers can place a plant or a leaf into a sealed container and then add CO2 into the container with a rare isotope of carbon, such as 14C. They can track the net movement of 14C from the air and into the plant tissues during photosynthesis and from the plant tissues back to the air during respiration. This net movement of 14C provides a measure of net primary productivity.
On a larger scale, such as a grassland or forest, researchers have developed techniques to measure CO2 uptake and release using towers that sample the concentration of CO2 at different heights above the ground. By measuring the concentration of CO2 moving up from the vegetation compared to the concentration of CO2 in the atmosphere, researchers can estimate the rates of photosynthesis and respiration that are occurring in an area.
Measuring O₂ Uptake and Release
In aquatic ecosystems, the dominant producers are typically algal cells. Because most algae are tiny, it is not always feasible to harvest and measure their biomass as a way to measure net primary productivity. Quantifying changes in CO2 concentration is also not a viable way to measure primary productivity because CO2 dissolved in water rapidly converts into bicarbonate ions, as we discussed in Chapter 2. However, because producers release O2 during photosynthesis and take up O2 during respiration, we can estimate NPP and GPP by measuring the uptake and release of O2.
To estimate primary productivity using O2 concentration in the water, we can use a process that is similar to estimating primary production based on CO2. That is, we can conduct a light-dark bottle experiment. We begin by immersing two bottles under the surface of the water to collect the algae. One bottle is clear, allowing sunlight to penetrate. In this bottle we measure the net increase in O2 production that occurs with the combined effects of photosynthesis and respiration by the algae. The other bottle is opaque, so sunlight cannot penetrate. In this bottle, the algae cannot photosynthesize but can only respire and drive down the concentration of O2. Because the clear bottle measures NPP and the opaque bottle measures only respiration, we can estimate GPP by adding the values obtained from each.
Remote Sensing
Remote sensing A technique that allows measurement of conditions on Earth from a distant location, typically using satellites or airplanes that take photographs of large areas of the globe.
The techniques we have discussed measure gross and net primary productivity on relatively small spatial scales, ranging from a single leaf to a small area of land to a small volume of water. What if we want to assess productivity on very large spatial scales, including changes in productivity across continents or oceans? One solution to this challenge is remote sensing. Remote sensing is a technique that allows measurement of conditions on Earth from a distant location, typically using satellites or airplanes that take photographs of large areas of the globe. These images allow scientists to determine how different wavelengths of light are reflected or absorbed. As we discussed in Chapter 3, chlorophyll pigments absorb wavelengths in the red and blue range but reflect wavelengths in the green range. Therefore, satellite images of ecosystems that show a pattern of high absorption of blue and red light and high reflectance of green light indicate ecosystems with high standing crops of producers. Changes in producer biomass over time can then be used to estimate net primary productivity.
Secondary Production
Primary productivity is the foundation of the food web because it represents the source of energy for herbivores. To understand how energy moves from producers to consumers, we need to consider a number of different pathways, shown in Figure 20.4. We begin with producers that herbivores consume. Herbivores consume only a small fraction of the total amount of producer biomass available and they can only digest a portion of the energy they consume. For example, many fruits contain hard seeds that herbivores cannot digest, so the seeds are excreted whole. We saw an example of this at the end of Chapter 17 when we discussed Aldabra tortoises that had been introduced to an island in the Republic of Mauritius. These tortoises consume fruits of the ebony tree and disperse the seeds when they defecate. The portion of consumed energy that is excreted or regurgitated is known as egested energy. In contrast, the portion of energy that a consumer digests and absorbs is known as assimilated energy.
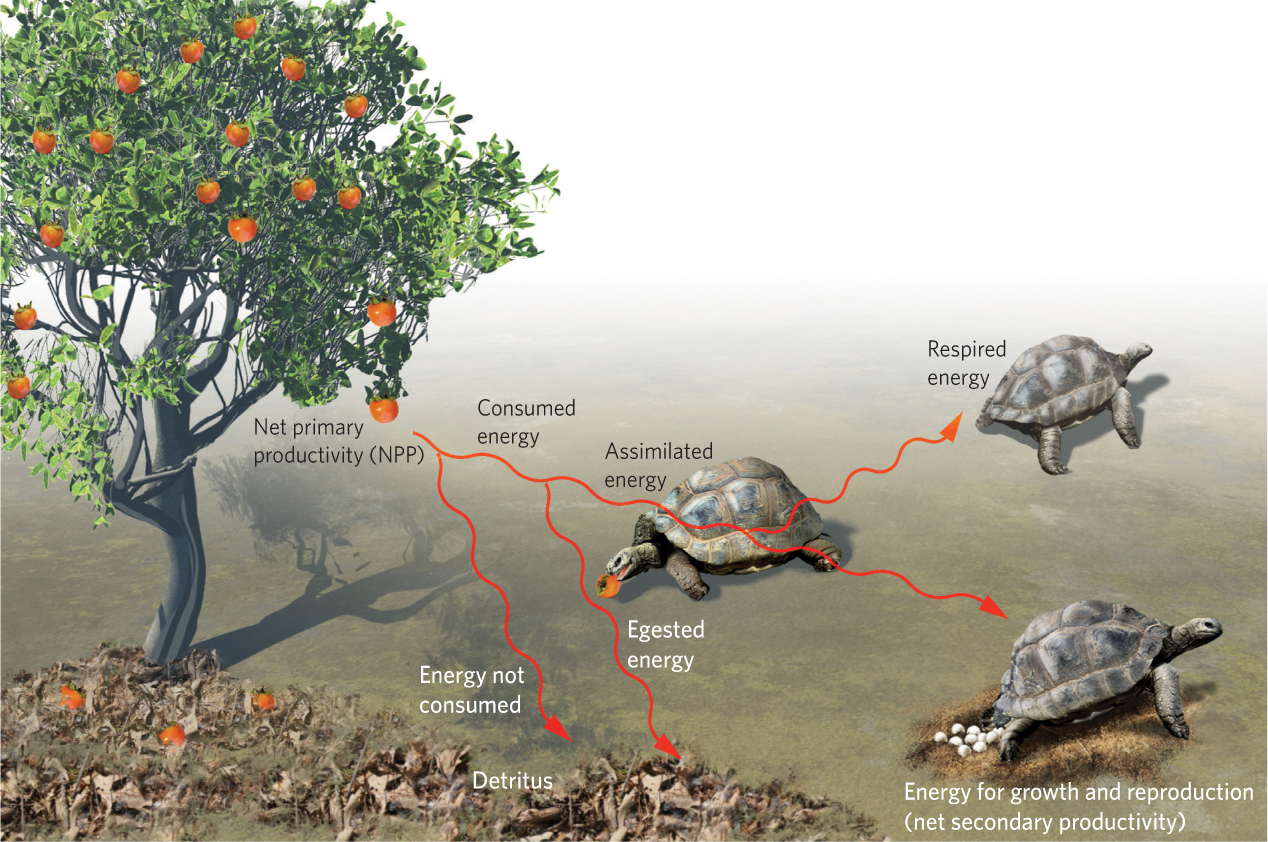
Egested energy The portion of consumed energy that is excreted or regurgitated.
Assimilated energy The portion of energy that a consumer digests and absorbs.
Respired energy The portion of assimilated energy a consumer uses for respiration.
Of the energy assimilated by a consumer, the portion used for respiration is known as respired energy. The rest can be used for growth and reproduction. For example, consumers such as fruit-eating birds need a great deal of energy for respiration to maintain a constant body temperature, whereas fruit-eating tortoises of the same mass need much less energy for respiration because they are ectotherms. As a result, birds devote more of their assimilated energy to respiration than tortoises do. Because the rate of assimilated energy of consumers is the amount of energy that is used for respiration, growth, or reproduction, it is analogous to the concept of GPP for producers.
473
Net secondary productivity The rate of consumer biomass accumulation in a given area.
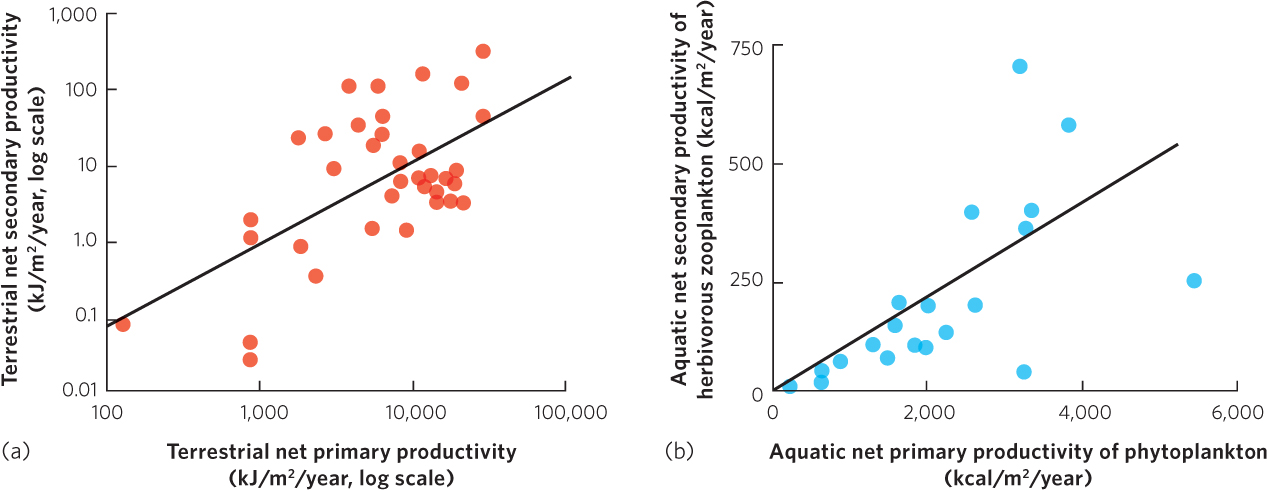
If we consider the assimilated energy of consumers and subtract the energy used for respiration, we are left with the energy used for biomass accumulation; the rate of biomass accumulation of consumers in a given area is called net secondary productivity. Because net secondary productivity depends on primary productivity as its source of energy, we might expect that an increase in net primary productivity would cause an increase in net secondary productivity. Researchers have compiled net primary and net secondary productivity estimates from a wide range of terrestrial biomes. As shown in Figure 20.5a, increases in net primary productivity are positively correlated with increases in net secondary productivity. In aquatic ecosystems, researchers have also found that increases in the productivity of phytoplankton—a dominant producer in many aquatic biomes—are positively correlated to the productivity of the herbivorous zooplankton that eat the algae, which you can see in Figure 20.5b.
Quantifying net secondary productivity has many of the same challenges as quantifying net primary productivity, including the need to account for herbivores that are removed from the ecosystem by predators or diseases. In addition, the positive correlation between net primary and secondary productivity suggests an important role of bottom-up control of communities, a concept we discussed in Chapter 18. However, we know that the top-down effects of predators also affect some communities.
474