Graphing The Data: Npp Versus the Total Primary Productivity of Ecosystems
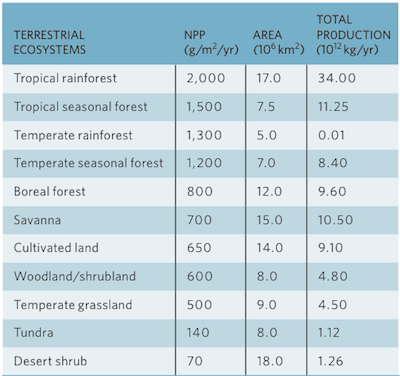
Figure 20.7 shows estimates of NPP for various ecosystems around the world. However, these data only tell us the amount of primary production per square meter. We can also examine the amount of primary production in terms of the total amount produced in a year among the different ecosystems. Using the data on NPP and area in the table, calculate total production for each ecosystem by multiplying NPP and area. Then plot the total production values using a bar graph.
Discuss how the NPP and the area of the different ecosystems affect total production.
| TERRESTRIAL ECOSYSTEMS | NPP (g/m2/yr) | AREA (106 km2) | TOTAL PRODUCTION (1012 kg/yr) |
|---|---|---|---|
| TROPICAL RAINFOREST | 2,000 | 17.0 | |
| TROPICAL SEASONAL FOREST | 1,500 | 7.5 | |
| TEMPERATE RAINFOREST | 1,300 | 5.0 | |
| TEMPERATE SEASONAL FOREST | 1,200 | 7.0 | |
| BOREAL FOREST | 800 | 12.0 | |
| SAVANNA | 700 | 15.0 | |
| CULTIVATED LAND | 650 | 14.0 | |
| WOODLAND/SHRUBLAND | 600 | 8.0 | |
| TEMPERATE GRASSLAND | 500 | 9.0 | |
| TUNDRA | 140 | 8.0 | |
| DESERT SHRUB | 70 | 18.0 |
| AQUATIC ECOSYSTEMS | |||
|---|---|---|---|
| SWAMP AND MARSH | 2,500 | 2.0 | |
| CORAL REEF | 2,000 | 0.6 | |
| SALT MARSH | 1,800 | 1.4 | |
| UPWELLING ZONES | 500 | 0.4 | |
| LAKE AND STREAM | 500 | 2.5 | |
| CONTINENTAL SHELF | 360 | 26.6 | |
| OPEN OCEAN | 125 | 332.0 | |
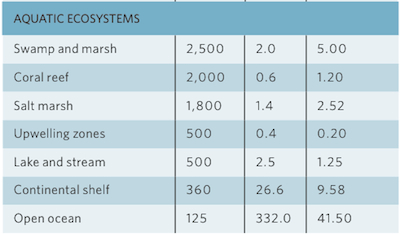
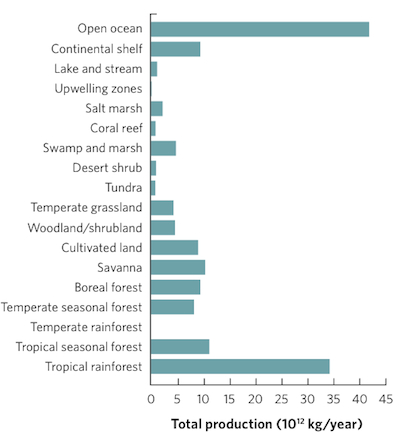
Some areas, such as the open ocean, do not have a high productivity per unit area, but the total area is so large that it contributes a relatively large amount to total production. In contrast, some highly productive ecosystems, such as swamps and marshes, do not cover a large area so they contribute a relatively small amount of total production
SOURCE: Data from Whittaker, R. H., and G. E. Likens. 1973. Primary production: The biosphere and man. Human Ecology 1: 57–369.