The equilibrium theory of island biogeography incorporates both area and isolation
When Robert MacArthur and E. O. Wilson examined the relationship between island size and species richness, they noticed that although the size of the island was strongly associated with the number of species, there was commonly a large amount of variation around the species–area curve that suggested other processes were also affecting the number of species living on the island. They considered the locations of the islands from which they collected data and observed that the distance from a source of colonizing species also affects the number of species living on an island. Islands closer to a source of colonizing species—for example a mainland—appeared to receive more colonizing species. In this section, we will examine the combined effects of island area and isolation on species richness and then explore a graphical model that helps us understand these patterns. Finally, we will explore how this information can be used to design nature reserves.
The Evidence
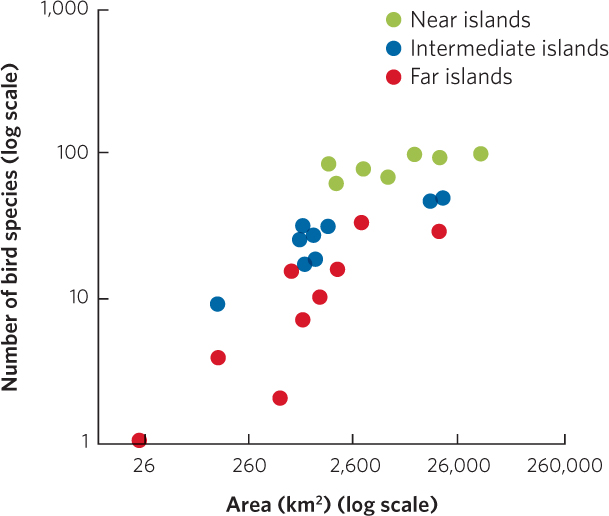
To test their hypothesis that species richness is determined by both island area and isolation, MacArthur and Wilson collected data on different types of organisms from groups of islands throughout the world. For example, they examined the number of bird species that existed on 25 islands in the South Pacific. The nearest source of new species for these islands was the large island of New Guinea, and these islands could be categorized as being near, intermediate, or far from New Guinea. When the researchers plotted the number of bird species for each island as a function of island area, shown in Figure 22.13, they found that both island area and the distance from New Guinea affected the number of species living on the island. Within each of the distance categories, larger islands contained more species. For islands of a given area, near islands contained more bird species than far islands.
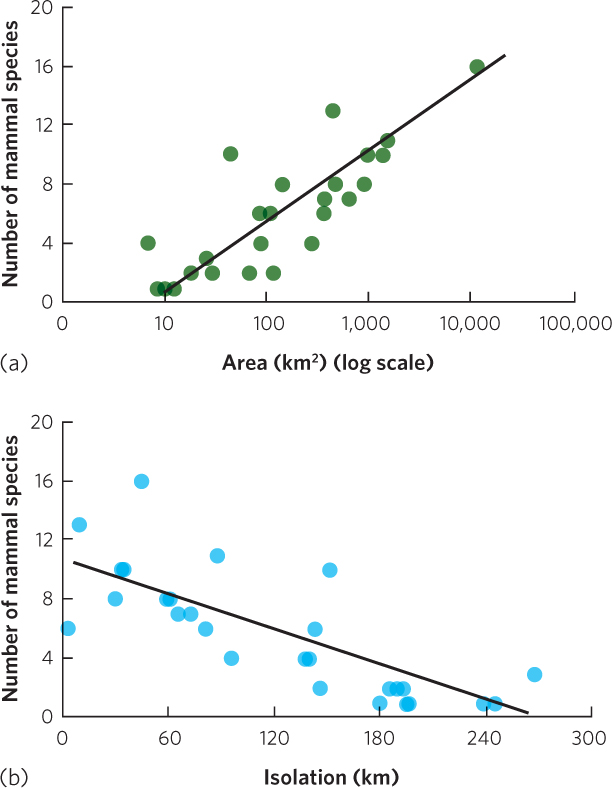
Although oceanic islands provide a good test of how colonization and extinction affect the number of species, we can also consider other types of distinct habitats including islands of habitat that exist on continents. For example, James Brown and his colleagues examined the number of mammal species living on mountaintops in the southwestern United States. These mountaintops include alpine tundra and conifer forest habitats that are surrounded by lower elevation habitats of woodlands, grasslands, and desert scrub. Twenty-six species of mammals in the region prefer to live in the mountaintop habitats. Researchers asked whether the number of mammal species on each mountaintop was affected by the area of the mountaintop or the isolation of the mountaintop from two sites containing sources of colonizing species: the southern Rocky Mountains and the Mogollon Rim, a mountain range that cuts across northern Arizona. As you can see in Figure 22.14, the researchers discovered more species of mammals on mountaintops with the largest areas and fewer species of mammals on mountaintops that were farthest away from the two sources of colonizers.
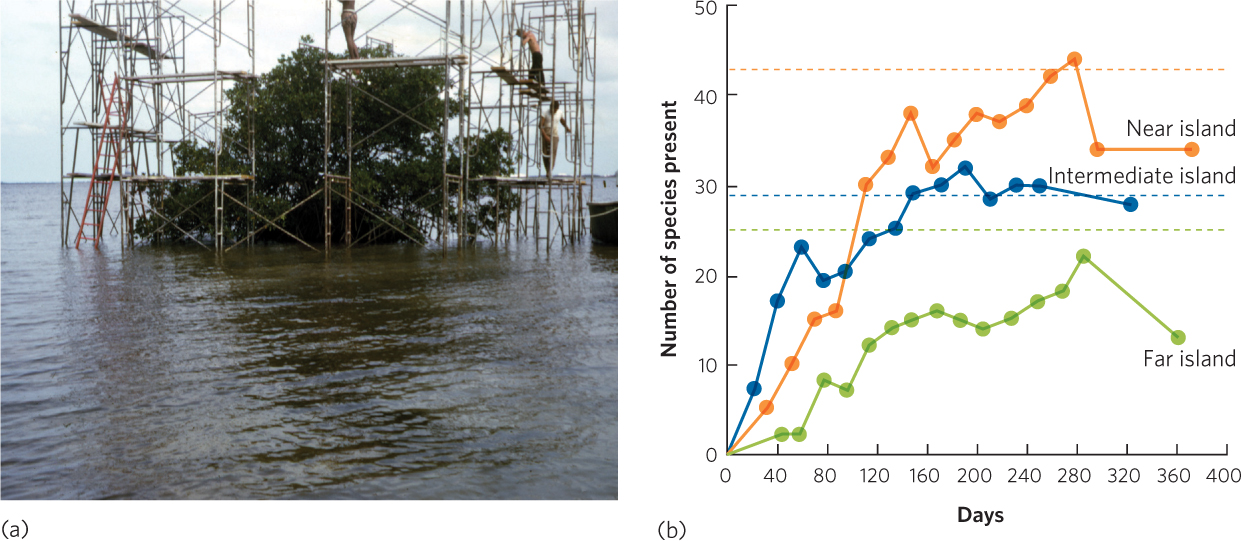
The observations on oceanic islands and mountaintop islands suggest that island area and isolation are important factors in determining species richness. However, a manipulative experiment was needed to demonstrate that these processes do, in fact, cause the observed pattern. In a classic experiment, Daniel Simberloff, a graduate student of E. O. Wilson, worked on a set of tiny islands in the Florida Keys. These islands typically contain a single mangrove tree and no animals other than insects, spiders, and other arthropods. Prior to the experiment, Simberloff and his team documented that islands located closer to sources of colonizing species contained more species than islands located far away from sources of colonizing species. The researchers built tents over selected islands, as you can see in Figure 22.15a, and then fumigated the islands with an insecticide that killed nearly every arthropod. After removing the tents, they returned to the islands every few weeks for a year to track how many species recolonized the islands from large islands nearby. As you can see in Figure 22.15b, the researchers found that each island was rapidly recolonized by arthropods. Moreover, the final number of species was close to the original number of species prior to the fumigation and the more isolated islands once again contained fewer species of arthropods. The actual list of species was different, but the richness was similar. This discovery was important because it experimentally demonstrated that isolation was a key factor in determining how many species could live on an island.
527
The Theory
Based on repeated observations that both island size and island isolation affect the number of species living on an island, Robert MacArthur and E. O. Wilson developed the equilibrium theory of island biogeography. The equilibrium theory of island biogeography states that the number of species on an island reflects a balance between the colonization of new species and the extinction of existing species.
Equilibrium theory of island biogeography A theory stating that the number of species on an island reflects a balance between the colonization of new species and the extinction of existing species.
528
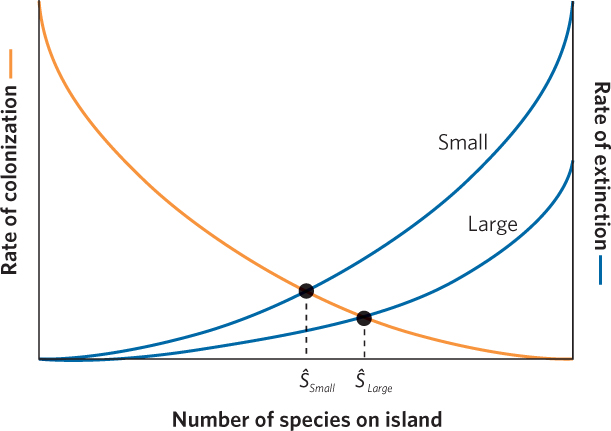
To understand the equilibrium theory of island biogeography, we need first to understand the factors that affect the colonization of species onto an island and the extinction of species from an island. As we discussed in Chapter 11, species differ in their ability to disperse depending on their overall size and mode of locomotion. So now imagine that we have an island that is completely uninhabited by any species. With no species on the island, a large number of species on the nearby mainland could potentially colonize it. As a growing number of species colonize the island, the pool of species that have not yet colonized the island shrinks and those that remain on the mainland are probably not very good at dispersing. Therefore, the rate of new species colonizing an island declines as a function of how many species have already colonized the island. If the island contained every species that is found on the nearby mainland, the rate of new colonizing species would fall to zero. In Figure 22.16, the relationship between species richness and rate of colonization by new species is shown as an orange line.
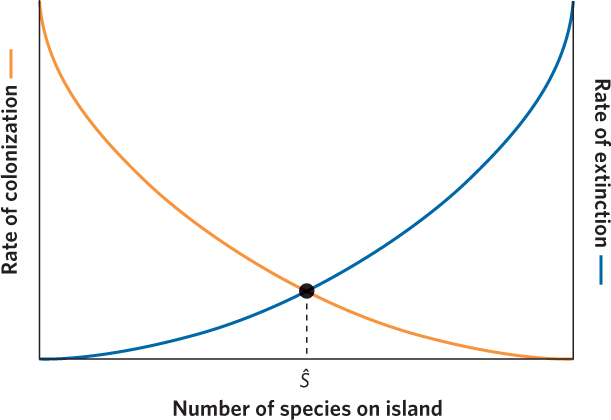
Next we need to consider the factors that affect the rate of extinction on an island. Since the extinction rate is expressed as the number of species that will go extinct over a period of time, the extinction rate must be affected by how many species are present. In the simplest case, when there are no species, there can be no extinctions. As the island begins to be colonized, it holds a few species that could potentially go extinct. As more species live on the island, more species are subject to possible extinction, and so the extinction rate increases. The extinction rate should also be affected by harmful species interactions on the island. For example, competition, predation, and parasitism are all more likely to increase as the total number of species increases. The blue line in Figure 22.16 shows that the extinction rate ranges from zero when no species are present on the island to a maximum rate of extinction when the island contains every species that it can possibly support.
Given that the island continues to experience colonization of new species and extinction of existing species, these two opposing forces will eventually reach an equilibrium point where the rate of colonization is equal to the rate of extinction. On our graphical model, equilibrium occurs where the two curves cross. Following the dashed line down from the equilibrium point, we see that the number of species on the island at equilibrium is designated as Ŝ on the x axis. In considering this figure, it is important to remember that the model predicts the number of species present at equilibrium, but it does not predict a particular composition of species at equilibrium. Even at equilibrium new species continue to colonize the island while species already on the island continue to go extinct. At equilibrium, there is still a continuous turnover of species on the island. We saw an example of this in the islands in the Florida Keys that were fumigated by Simberloff and Wilson. Over time, the species richness of the islands came to equilibrium, with the number of species depending on the distance between the island and the mainland. Once an island reached equilibrium, it contained a relatively fixed number of species, though the composition of species changed as the islands continued to experience extinctions and colonizations of invertebrate species.
Using the graphical model in Figure 22.16 as a foundation, we can make predictions about the combined effects of island size and isolation on the number of species on an island when it is at equilibrium. Let’s first consider the effects of island size. We would expect smaller islands to sustain smaller populations of each species. As we have discussed in several previous chapters, smaller populations typically have higher extinction rates. Therefore, smaller islands should experience higher rates of extinction, as shown by the curve labeled “Small” in Figure 22.17. When an island is at equilibrium, extinction rates balance colonization rates. Therefore the number of species on a small island at equilibrium should be lower than the number of species on a large island at equilibrium. If we follow the two equilibrium points on the figure down to the x axis, we can see that the number of species at equilibrium is lower for small islands than for large islands.
529
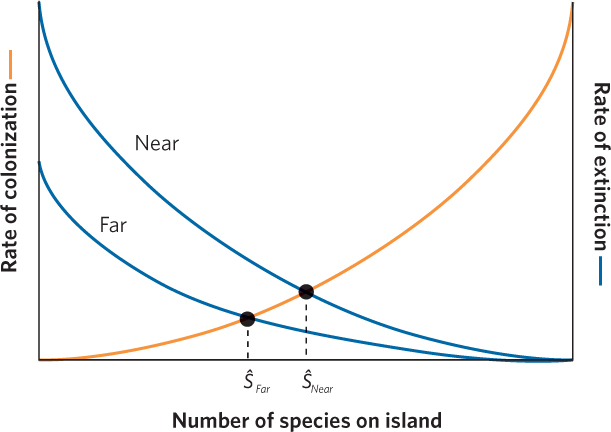
Next we can consider the effects of island isolation. An island that is near a continent should experience higher rates of colonization by new species than an island that is far from a continent. Once again using Figure 22.16 as our starting point, we can make predictions about how island isolation should affect the number of species at equilibrium. In Figure 22.18, we can see that the far island has a lower colonization curve than the near island. This creates two equilibrium points between colonization and extinction rates. If we follow the dashed lines down from each equilibrium point, we see that the number of species at equilibrium is lower for far islands than for near islands.
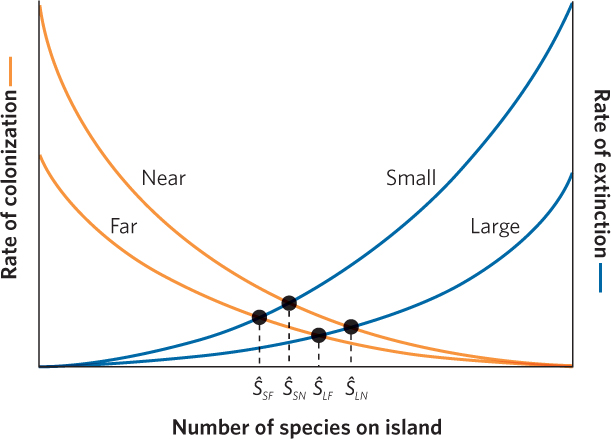
When we combine the effects of island size and island isolation from a continent, we arrive at several predictions. Looking at Figure 22.19, we see that the combinations of large versus small islands and near versus far islands creates four different possible equilibrium points. Once again, we can follow the dashed line down from each equilibrium point to determine how many species are predicted to be on a particular type of island when colonization and extinction rates are at equilibrium. Small islands that are far from a major source of new species should contain the fewest species. In contrast, large islands that are near a major source of new species should contain the most species. In short, the combination of island size and isolation determines the number of species that the island can hold.
Applying the Theory to the Design of Nature Reserves
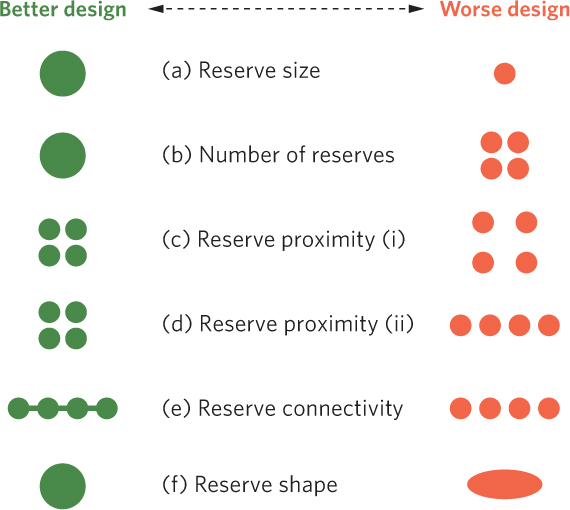
Understanding the effects of island size, shape, and distance from sources of colonizing species has helped scientists to design nature reserves to protect biodiversity, as depicted in Figure 22.20. For example, we know that large areas typically contain more species than small areas because they contain a greater diversity of habitats. Large areas can support larger populations of each species, which lowers the rate of species extinction. Based on these observations, we can say that setting aside large nature reserves will better protect biodiversity than will small nature reserves. Similarly, when faced with the option of setting up a single large reserve or several small reserves of the same total area, the single large reserve is often the better option to preserve biodiversity. However, a single habitat poses several risks. When a species of conservation concern is located in a single large habitat, it is more likely that the species will be destroyed by natural disaster or disease.
530
When we are faced with creating multiple reserves, we need to consider the proximity of the reserves to each other. Reserves need to be close enough for organisms to disperse between them but far enough away to reduce the ability for predators and diseases to move between them. Setting this distance is a compromise between these positive and negative outcomes, and the best solution will differ among organisms with different dispersal abilities. Sometimes the ideal distance will be set for the species of greatest conservation interest. A similar challenge exists when reserves are joined by corridors that provide strips of hospitable habitat between adjacent reserves.
Because we know that increased edge can have detrimental effects on species that prefer to live in the interior of habitats, it is also important that we consider reserve shape. Round reserves have the lowest ratio of edge to area while long, skinny ovals or rectangles have much higher edge to area ratios that will favor edge species. Although reserve size, number, shape, and proximity are all important considerations, often the ideal scenario is not possible; nature reserves typically represent a compromise between the areas that are desirable and the areas that are available.