Graphing The Data: Determining Q₁₀ Values in Salmon
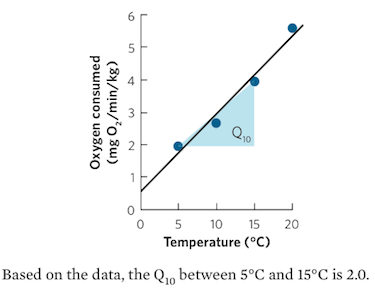
Salmon researchers measured the oxygen demands of the fish across a range of different water temperatures. Using their data in the following table, and with reference to Figure 2.18, create a graph that demonstrates how oxygen demand changes with temperature. Based on this graph, calculate the Q10 value for the salmon between 5 and 15°C.
|
TEMPERATURE (°C) |
OXYGEN DEMAND (mg O2/kg/minute) |
|---|---|
| 5 | 2.0 |
| 10 | 2.7 |
| 15 | 4.0 |
| 20 | 5.6 |