Graphing The Data: The Foraging Behavior Of American Robins
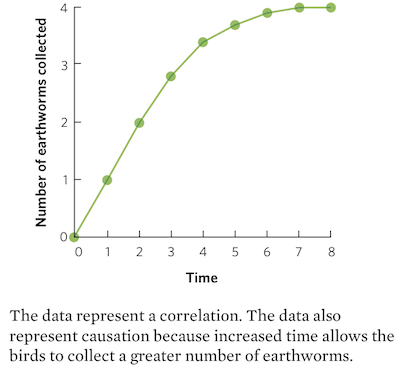
The following data were collected by a scientist observing the number of earthworms that American robins (Turdus migratorius) can hold in their beaks as they searched a lawn after a summer rain. Graph the data and describe the relationship between time and the number of collected earthworms. Does this correlation between time and the number of worms collected represent both a correlation and causation?
| TIME (min) | AVERAGE NUMBER OF EARTHWORMS COLLECTED |
|---|---|
| 0 | 0 |
| 1 | 1.0 |
| 2 | 2.0 |
| 3 | 2.8 |
| 4 | 3.4 |
| 5 | 3.7 |
| 6 | 3.9 |
| 7 | 4.0 |
| 8 | 4.0 |