Graphing The Data: Precipitation in Mexico City, Quito, and La Paz
As we have seen in this chapter, cities around the world often differ in their pattern of monthly precipitation. Using the data provided in the table, create a bar graph for each of the three cities.
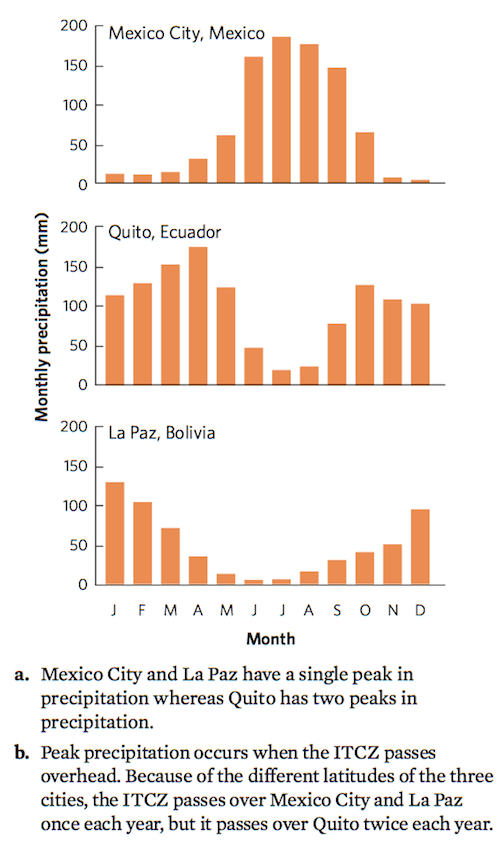
(a) Based on these graphs, how many peaks in precipitation does each city receive? (b) Based on their geographic locations, why does the number of peaks in precipitation in these cities differ?
AVERAGE MONTHLY PRECIPITATION (mm) IN THREE CITIES
| MONTH | MEXICO CITY, MEXICO | QUITO, ECUADOR | LA PAZ, BOLIVIA |
|---|---|---|---|
| JANUARY | 10.2 | 114.3 | 129.5 |
| FEBRUARY | 10.2 | 129.5 | 104.1 |
| MARCH | 12.7 | 152.4 | 71.1 |
| APRIL | 27.9 | 175.3 | 35.6 |
| MAY | 58.4 | 124.5 | 12.7 |
| JUNE | 157.5 | 48.3 | 5.1 |
| JULY | 182.9 | 20.3 | 7.6 |
| AUGUST | 172.7 | 25.4 | 15.2 |
| SEPTEMBER | 144.8 | 78.7 | 30.5 |
| OCTOBER | 61.0 | 127.0 | 40.6 |
| NOVEMBER | 5.1 | 109.2 | 50.8 |
| DECEMBER | 0.8 | 104.1 | 94.0 |