Graphing The Data: Natural Selection on Finch Beaks
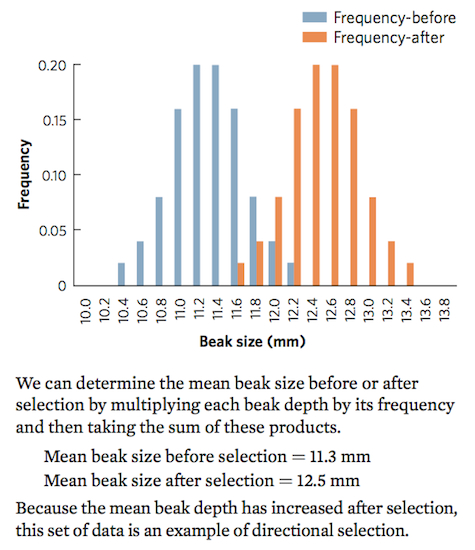
The following table lists the frequency distributions of finch beak sizes, both before and after selection. Using a bar graph, plot the relationships between beak size and frequency. Then determine how much the mean beak size changed due to selection and decide which type of selection has occurred.
| BEAK SIZE(mm) | FREQUENCY BEFORE SELECTION | FREQUENCY AFTER SELECTION | R |
|---|---|---|---|
| 10.0 | 0.00 | 0.00 | |
| 10.2 | 0.00 | 0.00 | |
| 10.4 | 0.02 | 0.00 | |
| 10.6 | 0.04 | 0.00 | |
| 10.8 | 0.08 | 0.00 | |
| 11.0 | 0.16 | 0.00 | |
| 11.2 | 0.20 | 0.00 | |
| 11.4 | 0.20 | 0.00 | |
| 11.6 | 0.16 | 0.02 | |
| 11.8 | 0.08 | 0.04 | |
| 12.0 | 0.04 | 0.08 | |
| 12.2 | 0.02 | 0.16 | |
| 12.4 | 0.00 | 0.20 | |
| 12.6 | 0.00 | 0.20 | |
| 12.8 | 0.00 | 0.16 | |
| 13.0 | 0.00 | 0.08 | |
| 13.2 | 0.00 | 0.04 | |
| 13.4 | 0.00 | 0.02 | |
| 13.6 | 0.00 | 0.00 | |
| 13.8 | 0.00 | 0.00 |