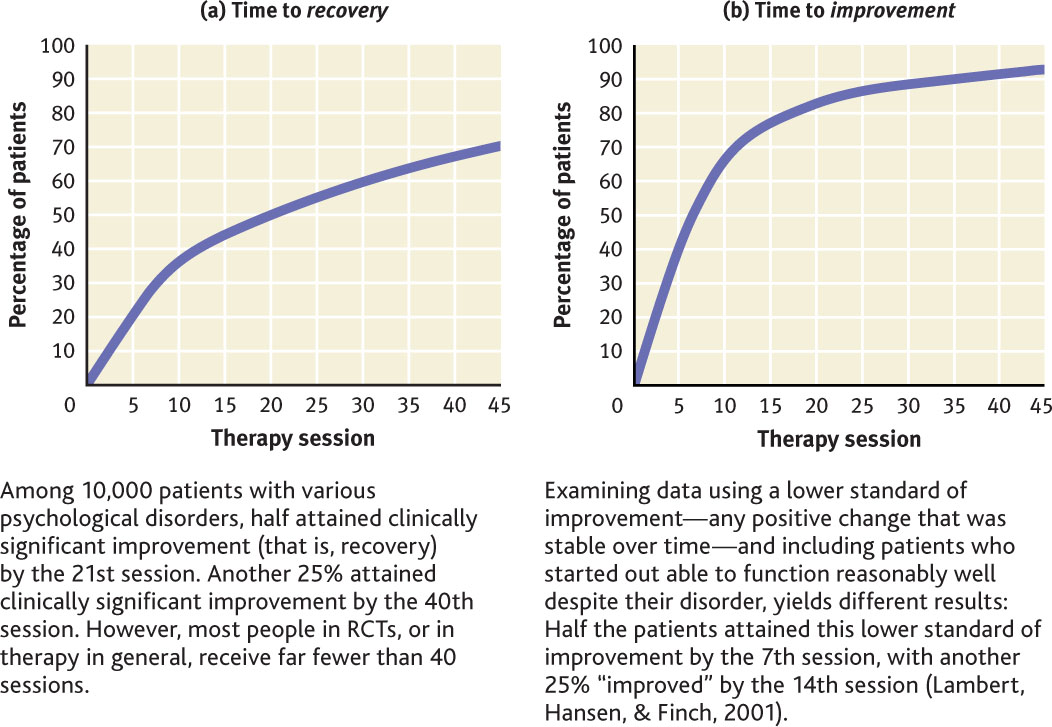
FIGURE 4.5 • The Dose–Response Relationship Comparing a more stringent definition of “improvement” (Figure 4.5a) to a more liberal one (Figure 4.5b) makes it clear that the exact criteria for improvement determine the particular height and shape of the curve for the dose–response relationship.
Source: Lambert et al., 2001.
[Leave] [Close]