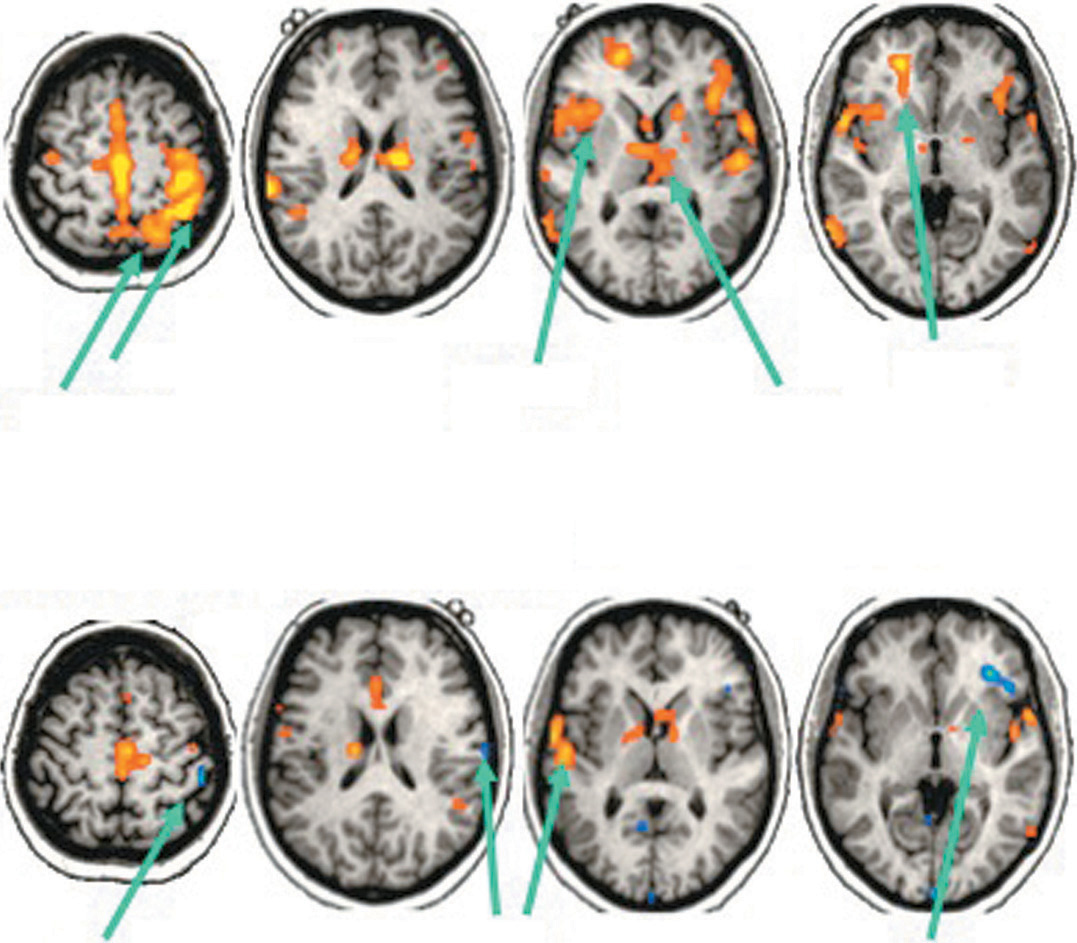
FIGURE 8.3 • Brain Activation in Conversion Disorder: Healthy Limb Versus Affected Limb Brain areas activated when the skin of the healthy, nonaffected limb was stimulated (top row) compared to those activated when the skin of the affected limb was stimulated (bottom row); arrows show the key areas of activation (Mailis-Gagnon et al., 2003). It’s clear that the scans in the bottom row show much less activation.
Source: A. Mailis-Gagnon, M.D., et al., Neurology 2003;60:1501–1507. © 2003 American Academy of Neurology.
[Leave] [Close]