CHAPTER 23 Test Your Knowledge
DRIVING QUESTION 1
What are ecosystems, and how are ecosystems being affected by climate change?
By answering the questions below and studying Infographics 23.1, 23.2, 23.3, and 23.6 and Up Close: Biomes, you should be able to generate an answer for the broader Driving Question above.
KNOW IT
 Which of the following are parts of an ecosystem?
a. the plant life present in a given area
b. the animals living in a given area
c. the amount of annual rainfall in a given area
d. the soil chemistry in a given area
e. none of the above
f. all of the above
f
 List several examples of species discussed in this chapter that have changed their geographic distributions or the timing of events in their life cycle as a result of global climate change.
Maple trees are producing less sap because of fewer days of optimal temperature. Tropical fish are moving into northern oceans. Flowering plants are flowering earlier in the spring. Marmots are emerging earlier from hibernation. Polar bears are facing starvation because of melting sea ice.
 In identifying a biome, for which of the characteristics below would it be most important to have data? (Select all that apply.)
a. monthly rainfall
b. temperatures throughout the year
c. plant life
d. animal life
e. size of the human population in the area
Monthly rainfall and temperatures are very important, as are the defining plants in the area.
 Which biome is characterized principally by evergreen trees?
Coniferous forest biome
 Look at Up Close: Biomes. Where in North and South America do you find temperate forest? Tropical forest?
Temperate deciduous forest is in eastern North America; tropical forest is in Central America and northern South America.
 If global warming causes Arctic sea ice to melt, what will be the effect on sea levels in a low-lying region like Miami? If large parts of the Antarctic polar ice cap should melt, what would be the effect on sea level?
Melting sea ice will not change sea levels. However, melting ice caps will cause a rise in sea levels, which can put low-lying cities (such as Miami) at risk for flooding.
USE IT
 Although trees may not be able to walk away from increasingly warm regions, evolutionary adaptations may allow trees to survive in warmer regions. Discuss each of the adaptations listed below and decide if it is likely to be helpful or harmful in a warming environment. (Think about water—water is taken up by the roots of plants, and lost through pores in the leaves; CO2 levels—CO2 is taken up by plants through pores in leaves, then used by leaves for photosynthesis; and the movement of other species, for example insects, in response to global warming.)
a. having smaller leaves
b. having a larger number of pores on each leaf
c. having thicker and waxier bark
a: Having smaller leaves reduces the amount of water loss but also limits the amount of CO2 that can be taken up. However, as rising temperatures are due to greenhouse gases such as CO2, the smaller area may not be as much of a liability in the presence of elevated atmospheric CO2. Overall, having smaller leaves is likely to be helpful. b: Having a larger number of pores on each leaf allows for entry of more CO2 but also leads to more water loss. In this case, the enhanced water loss is probably a stronger liability than the enhanced CO2 uptake. Overall, having more pores is likely to be harmful. c: Having thicker and waxier bark limits water loss but won’t have an impact on photosynthesis, as bark is not photosynthetic. A thicker bark may also be harder for insects to eat, protecting the plant from potentially increased insect activity in the face of warming temperatures. Overall, having thicker and waxier bark is likely to be helpful.
 What is a possible risk for humans if insects that carry pathogenic bacteria or viruses expand their range northward?
If insects that carry pathogenic bacteria or viruses move northward, then some human populations may be exposed to novel pathogens. In such cases, humans who have not previously been exposed to a particular pathogen have no immunity, so the infections may be very severe. This could cause high rates of disease and death.
DRIVING QUESTION 2
What is the greenhouse effect, and what does it have to do with global warming?
By answering the questions below and studying Infographics 23.4, 23.5, 23.7, 23.8, and 23.11, you should be able to generate an answer for the broader Driving Question above.
KNOW IT
 Which greenhouse gas is emitted every time you breathe out?
a. oxygen
b. carbon dioxide
c. methane
d. nitrogen
e. water vapor
b
 Which of the following organisms contributes to reducing atmospheric CO2 levels?
a. maple trees
b. most algae
c. polar bears
d. pear thrips
e. a and b
f. a, b, and d
e
 Could we live in the absence of the greenhouse effect? Explain your answer.
No. The greenhouse effect helps trap heat in the environment. In the absence of the greenhouse effect, the temperature of the planet would be too cold to support life as we know it.
507
USE IT
 Explain how each of the following contributes to an elevation of levels of greenhouse gases.
a. large-scale slash-and-burn agriculture
b. driving gasoline-fueled cars
c. producing cattle for beef and dairy products
d. rice production
a: Slash-and-burn agriculture cuts down large trees and burns them to make space for crops. The burning releases a huge amount of stored carbon as CO2. As the crops that are planted are not usually sustained after a few years, the amount of CO2 that they remove from the atmosphere by photosynthesis is far less in the long run than that removed by the trees that were originally present. b: Driving gasoline-fueled cars releases CO2 in the burning of gas, a fossil fuel. The carbon stored in fossil fuels is not circulating in the atmosphere until the fossil fuels are extracted and combusted. c: Beef and dairy cattle harbor methane-producing microbes in their digestive tracts. These microbes release methane (a potent greenhouse gas) into the atmosphere. d: The cultivation of rice in paddies also contributes to the release of methane, by microorganisms that live in the muck of the rice paddies.
DRIVING QUESTION 3
How do carbon and other chemicals cycle through ecosystems?
By answering the questions below and studying Infographic 23.9 and Up Close: Chemical Cycles, you should be able to generate an answer for the broader Driving Question above.
 Fill in the blanks in the image below.
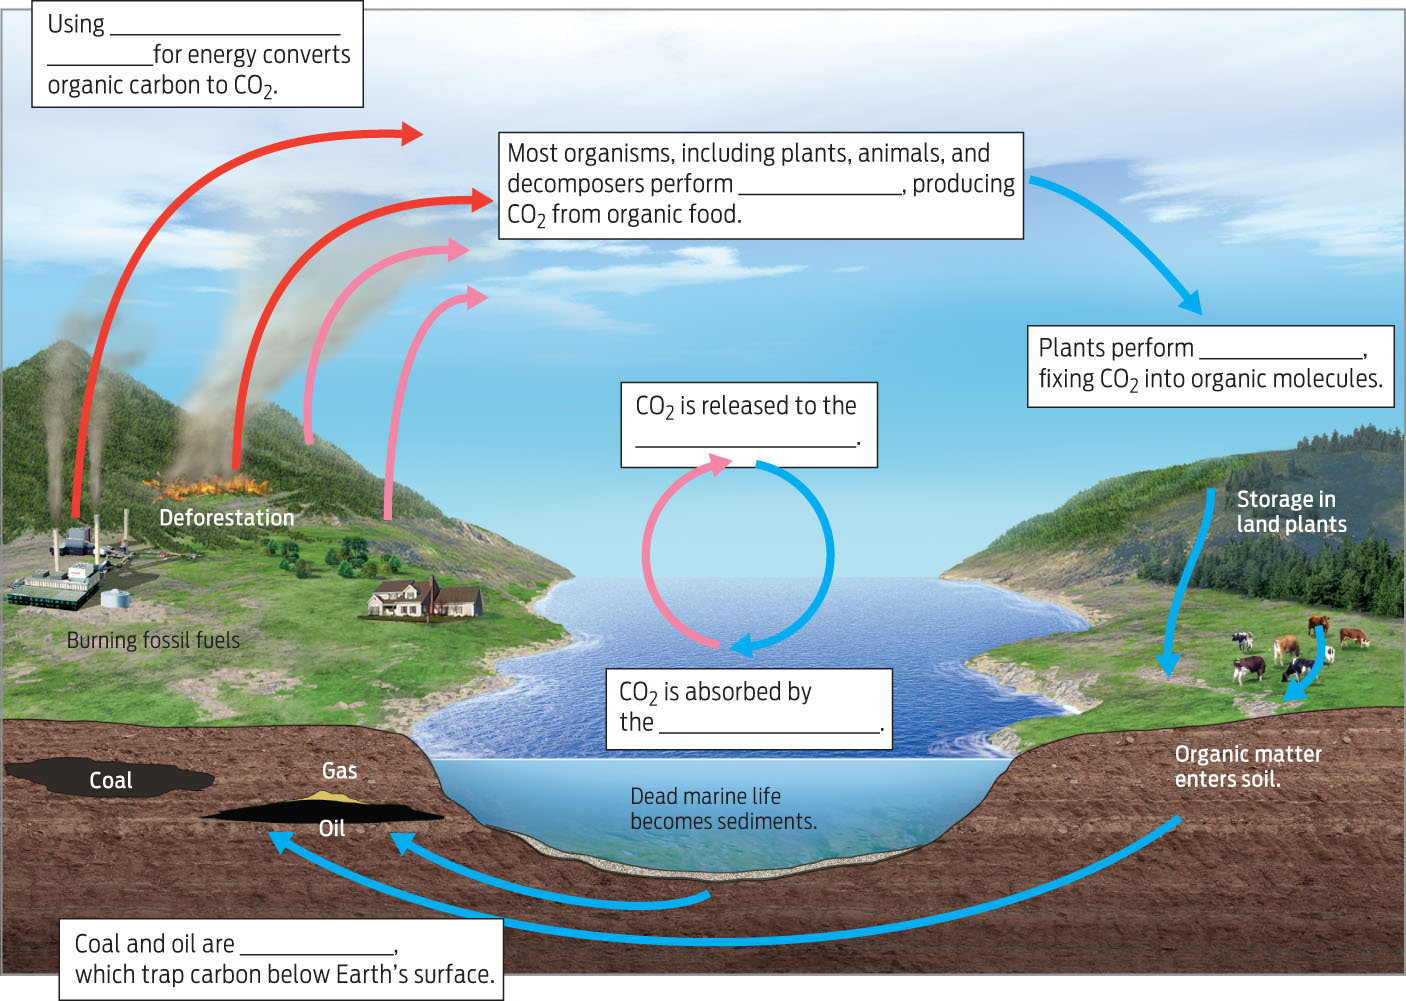
Using fossil fuels for energy converts organic carbon to CO2.
Most organisms, including plants, animals and decomposers perform cellular respiration, producing CO2 from organic food.
CO2 is released to the atmosphere.
CO2 is absorbed by the oceans.
Plants perform photosynthesis, fixing
CO2 into organic molecules.
Coal and oil are fossil fuels, which trap carbon below the surface.
KNOW IT
 Decomposers ________________ CO2 by the process of ________________.
a. emit; photosynthesis
b. take up; photosynthesis
c. emit; cellular respiration
d. take up; cellular respiration
e. store; cellular respiration
c
 Atmospheric nitrogen is in the form of
a. N2.
b. proteins.
c. ammonium (NH4+).
d. nitrates (NO32).
e. any of the above
a
508
MINI CASE
 For more than 30 years, a system of lakes in northwestern Ontario, Canada, called the Experimental Lakes, has been used to study the impacts of various pollutants in order better to understand how to maintain healthy freshwater ecosystems. A challenge in many aquatic ecosystems is eutrophication—nutrient enrichment that leads to overgrowth of algae. When the algae die, the decomposers use so much oxygen as they feast on the dead algae that other organisms in the ecosystem cannot survive. Eutrophication led to loss of many fish from Lake Ontario in the 1960s and 1970s. In one of the Experimental Lakes, two basins of the lake were separated by a plastic sheet. The basin shown at the bottom of the photo below received nitrogen, phosphorus, and carbon. The basin shown at the top of the photo received only carbon and nitrogen. The green scum covering the water surface is algae.
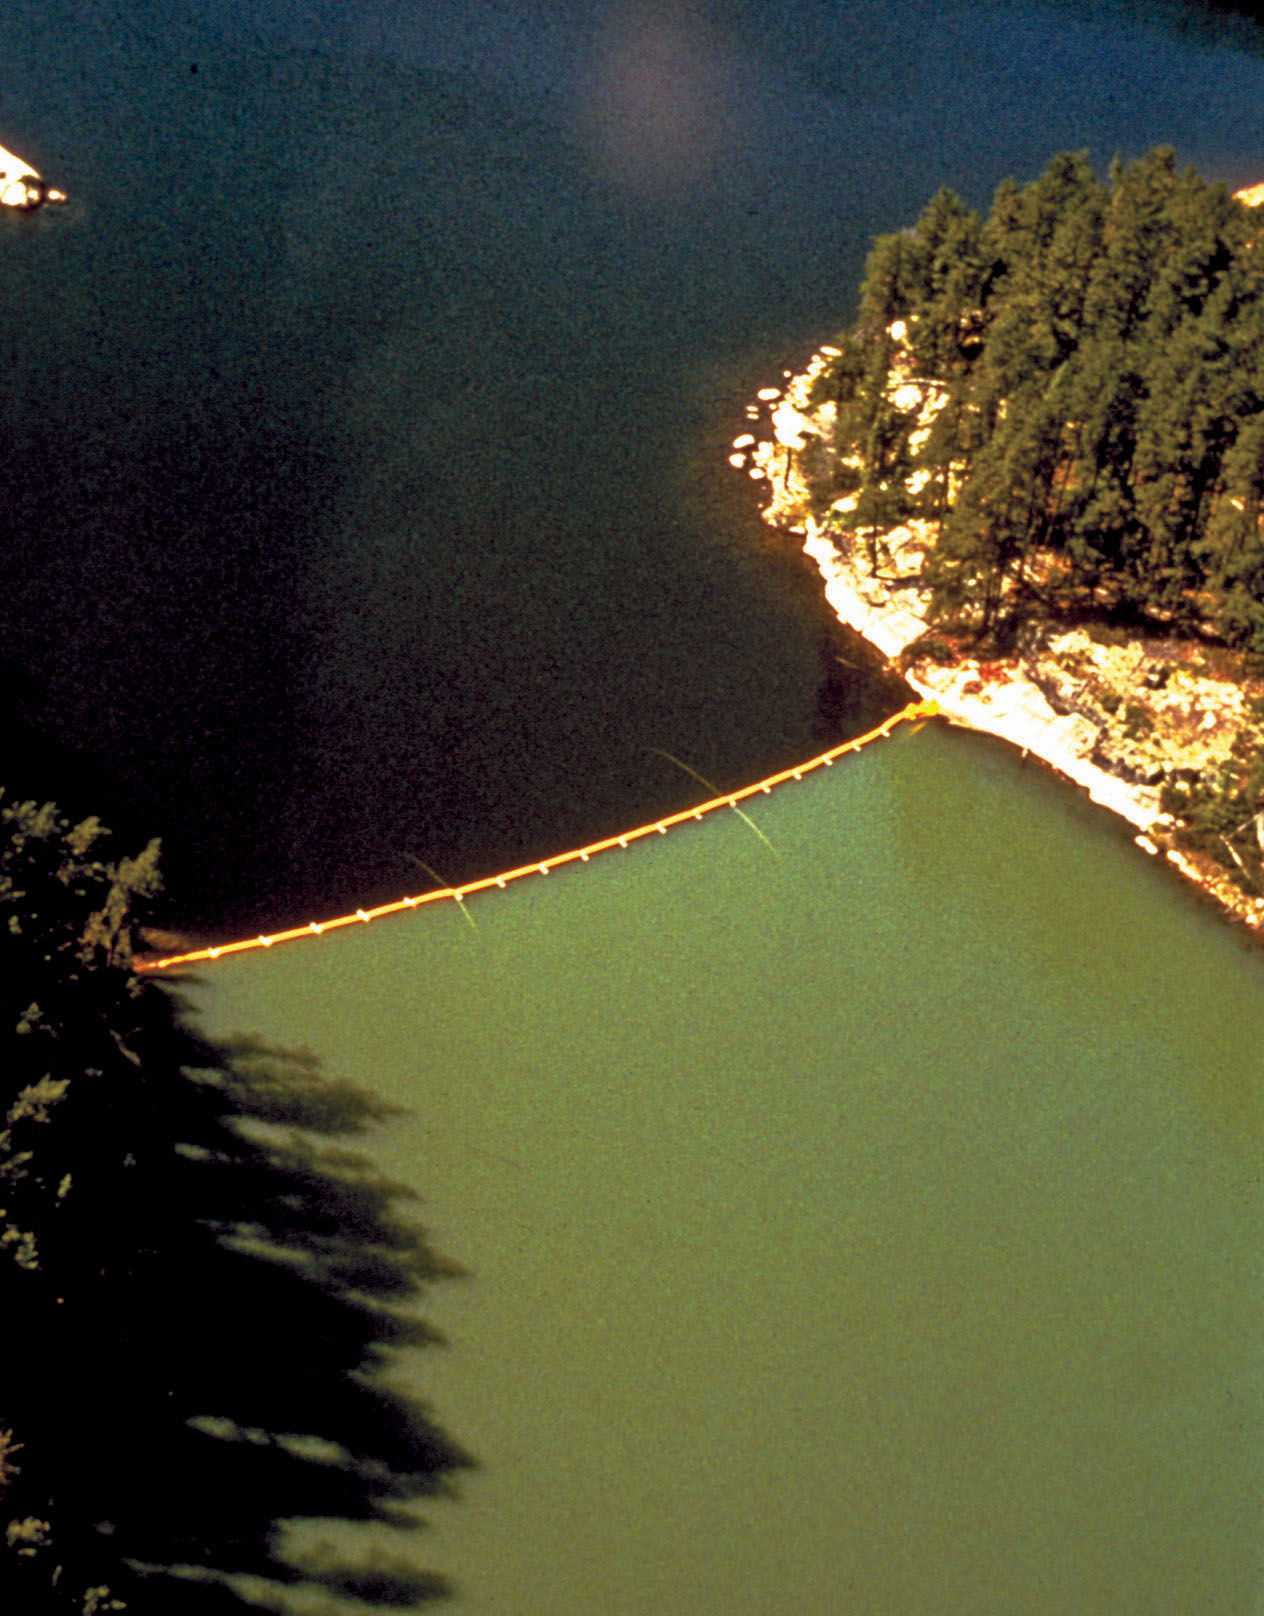 a. What nutrient is most important in the eutrophication process?
b. What are human-derived sources of this nutrient?
c. Do some online research to see what measures were taken in Ontario to prevent eutrophication.
a: phosphorus b: The main human-derived source is phosphates in detergents. These can run off (in waste water) to the lakes. c: Ontario banned phosphate-containing laundry detergents and also mandated that phosphorus be removed from municipal waste before it could be dumped into the Great Lakes.
DRIVING QUESTION 4
How are scientists able to compare present-day levels of atmospheric carbon dioxide to past levels, and why would they want to?
By answering the questions below and studying Infographics 23.5, 23.9, 23.10, and 23.11, you should be able to generate an answer for the broader Driving Question above.
KNOW IT
 Fossil fuels are most immediately derived from
a. organic molecules.
b. CO2.
c. methane.
d. melting ice caps.
e. photosynthesis.
a
 Name at least two human activities that increase CO2 levels in the atmosphere and two natural processes that contribute CO2 to the atmosphere.
Burning fossil fuels (e.g., by driving cars) and eating red meat increase atmospheric CO2 levels. Decomposition increases CO2 levels in the atmosphere, as do forest fires.
USE IT
 How is ice useful in the measurement of atmospheric levels of CO2?
Ice traps air bubbles. The air bubbles contain dissolved CO2 at the levels found in the atmosphere at the time the air was trapped.
 Describe the evidence that increasing levels of greenhouse gases are responsible for global climate change. What if someone suggested to you that global climate change is due to increased intensity of solar radiation (i.e., the amount of sunlight reaching Earth)? What kind of evidence would you ask this person to provide to support this hypothesis?
The evidence supporting global greenhouse gases as being responsible for global climate change include: the fact that current atmospheric CO2 levels are higher than they have been in a very long time (hundreds of thousands of years); the fact that direct measurements of CO2 in the atmosphere have shown a rapid increase in the last ~140 years; the fact that the increase in CO2 concentrations parallel the increasing global temperatures. In order to support the hypothesis that increased solar radiation is responsible for global climate change, it would be necessary to show that worldwide levels of solar radiation are increasing at the same rate as global temperatures, particularly over the same period of time (~140 years) for which we have CO2 data.
 Which of the following data would you use to determine the levels of atmospheric CO2 in 1750? Justify your choice, including an explanation of why the other alternatives would not be as effective.
a. historical weather records of daily temperatures
b. archives of the Manua Loa Observatory (to examine records from 1750)
c. tree-ring analysis (to look for evidence of extreme fires)
d. ice cores from ice formed in 1750
The ideal data would be the analysis of ice cores formed in 1750 (choice d). Historical temperature records do not directly measure CO2. The Manua Loa observatory was not recording data in 1750, and tree-ring analysis will not reveal CO2 levels.
BRING IT HOME
 Visit an online carbon footprint or carbon emissions calculator (for example, http://www.epa.gov/climatechange/ghgemissions/ind-calculator.html) and calculate your total carbon emissions.
a. What is your largest source of emissions?
b. What steps can you take to decrease your carbon emissions?
c. Explain how drying your laundry on a clothesline rather than in the dryer can decrease your carbon emissions.
a: Answers will vary. Common sources include fossil-fuel powered vehicles, household appliances (which typically run on natural gas or coal-fueled electricity), extensive air travel, and purchasing goods that are transported long distances by air. b: Emissions from these sources can be reduced by taking public transportation, walking, or riding bikes. Minimizing unnecessary use of electrical appliances and unplugging appliances when they are not in use reduces electrical usage. Buying locally made goods can reduce emissions associated with transportation. c: Air drying clothes reduces the amount of electricity (or gas) used to power the clothes dryer. As electricity is most commonly produced at coal-fired plants, reducing electrical usage reduces the amount of coal burned for electricity.
509
INTERPRETING DATA
 A 2010 study compared the amount of CO2 emitted when locally grown broccoli was delivered to Virginia Tech University with the amount emitted when broccoli grown in California was delivered to Virginia Tech. The California broccoli was delivered in shipments containing 768 lbs of broccoli, in a tractor-trailer that traveled 2,786 miles. Tractor-trailer fuel efficiency is 5 miles per gallon, and 20 lbs of CO2 are released per gallon of fuel burned. The local broccoli was delivered in shipments of 587 lbs of broccoli in a cargo van that traveled 19.1 miles. Cargo van fuel efficiency is 16 miles per gallon, and 20 lbs of CO2 are released per gallon of fuel burned.
a. Complete the table below to determine the CO2 emissions associated with delivering 1 lb of local and 1 lb of nonlocal broccoli.
b. Is locally sourced fresh broccoli a year-round option at Virginia Tech?
c. Do some online research to determine approximately what proportion of CO2 emissions are associated with food delivery vs. food production.
a:
| Source of Broccoli | Miles per Shipment | Gallons of Fuel Burned per Shipment | CO2 Released per Shipment (lbs) | CO2 Released per lb of Broccoli Delivered |
| Nonlocal | 2786 | 557.2 | 11,144 | 15.51 |
| Local | 19.1 | 1.19 | 23.88 | 0.04 |
c: Many lines of evidence point to food production as a greater culprit in terms of emissions because of factors such as transport of fertilizers to farms.
SOURCE: Schultz, J. and Clark, S. (2010) Foodprint Comparison of Local vs Nonlocal Produce.
http://www.blacksburgfarmersmarket.com/docs/Schultz_Foodprint_Comparison_of_Local_vs_Nonlocal.pdf (accessed 5/4/2013)