CHANGING BY CHANCE: GENETIC DRIFT
Peromyscus leucopus—the white-footed mouse—is one of the oldest residents of Manhattan, long predating the arrival of the first colonists in the 1600s. The rodent squeaks out a living in the green spaces of the city—essentially any park that has canopy cover. There are more than a dozen distinct populations of white-footed mice living across the city.
When Munshi-South initially had the idea of studying mice in New York City, he thought there probably wouldn’t be many genetic differences among the different populations living there; New York is a fairly young city, and evolutionary change generally happens slowly. But the results of his study clearly showed that was not the case.
“It turned out that actually the populations are fairly distinct in the parks,” says Munshi-South. And these differences have come about over a relatively short period of evolutionary time—a few hundred years at the most.
Over three centuries, as New York City has gone from a rich tapestry of forest to a sparse patchwork of fragmented green spaces, populations of white-footed mice have become trapped in little islands of green, cut off from their distant cousins in the rest of the city. What this means is that each population of mice has its own distinct gene pool, and evolution is occurring differently in each local population.
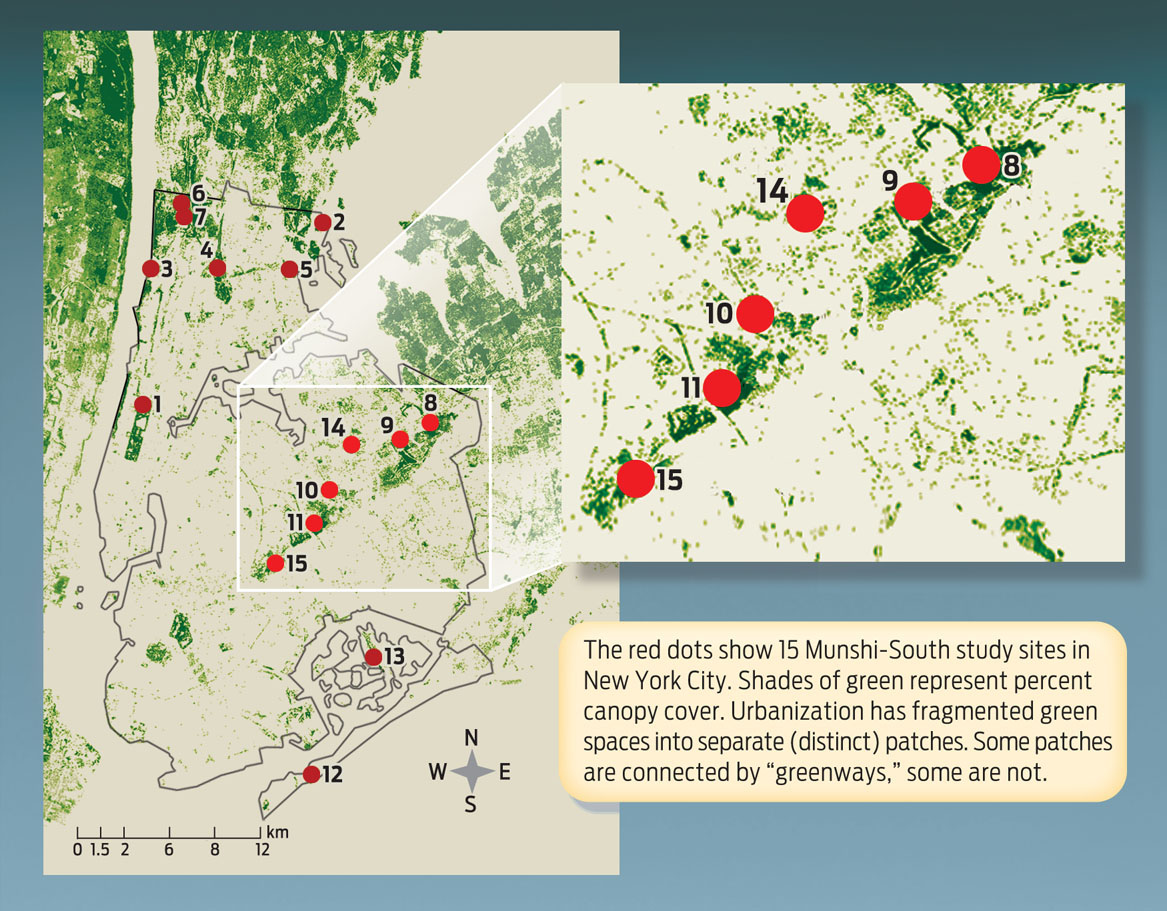
To peer into these gene pools, Munshi-South and his colleagues analyzed mice from 15 different populations around New York City. Using mousetraps baited with birdseed, they caught a total of 312 individual mice from these populations. After catching each mouse, researchers cut off the tip of its tail and put it in ethanol; DNA from the piece of tail could later be extracted and sequenced at specific chromosome locations (see Chapter 7). The mice, which were not seriously harmed by this procedure, were then released back into the wild.
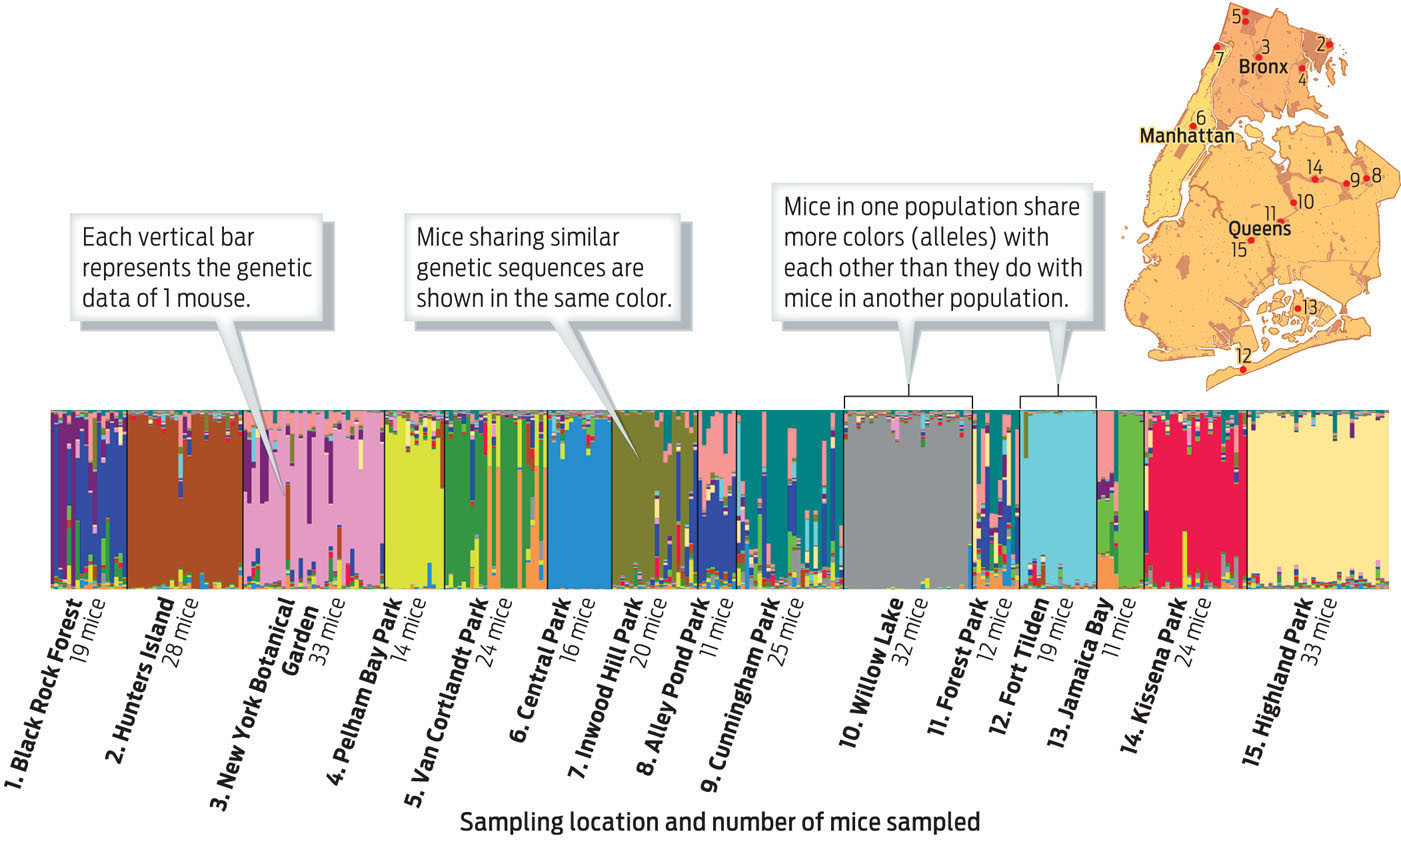
When DNA sequences at 18 different chromosome locations from all 312 mice were assessed, the results showed distinct clustering of alleles, with mice within one population tending to share more alleles with one another than with mice from other populations. In fact, says Munshi-South, you can accurately predict where a mouse is from just by looking at its DNA (INFOGRAPHIC 15.2).
Researchers collected tail DNA from 312 mice at 15 locations in New York City. Once they analyzed each mouse’s DNA, the researchers wanted to get a sense of how related the populations were. They assigned mice with similar genotypes particular colors and sorted all the mice by location. They found that mice within a population shared more alleles with one another than they did with mice from other populations.
GENETIC DRIFT Random changes in the allele frequencies of a population between generations; genetic drift tends to have more dramatic effects in smaller populations than in larger ones.
How did these genetic differences among populations come about? One possibility is that each population of mice evolved by natural selection as a result of local differences in the environment—perhaps each different green space has different predators or food sources, for example, which selected for individuals with different alleles. Given how close these green spaces are to one another, however—in some cases, less than a mile up the road—and given also how similar the environments are, this explanation isn’t the most likely one. More likely, says Munshi-South, is genetic drift.
Genetic drift is a bit like rolling the evolutionary dice. By simple chance, some individuals survive and reproduce, and others do not. Those that pass on their genes aren’t necessarily more fit or better adapted; they’re just lucky—perhaps their nest or burrow wasn’t swept away in a flash flood, for example.
Over time, genetic drift tends to decrease the genetic diversity of a population, as some alleles are lost completely and others sweep to 100% frequency. Genetic drift will have more dramatic effects in smaller populations than in larger ones, because in a population with few individuals any single individual that does not reproduce could spell the loss of alleles from the population. But all populations experience some measure of genetic drift, since chance is a fact of life.
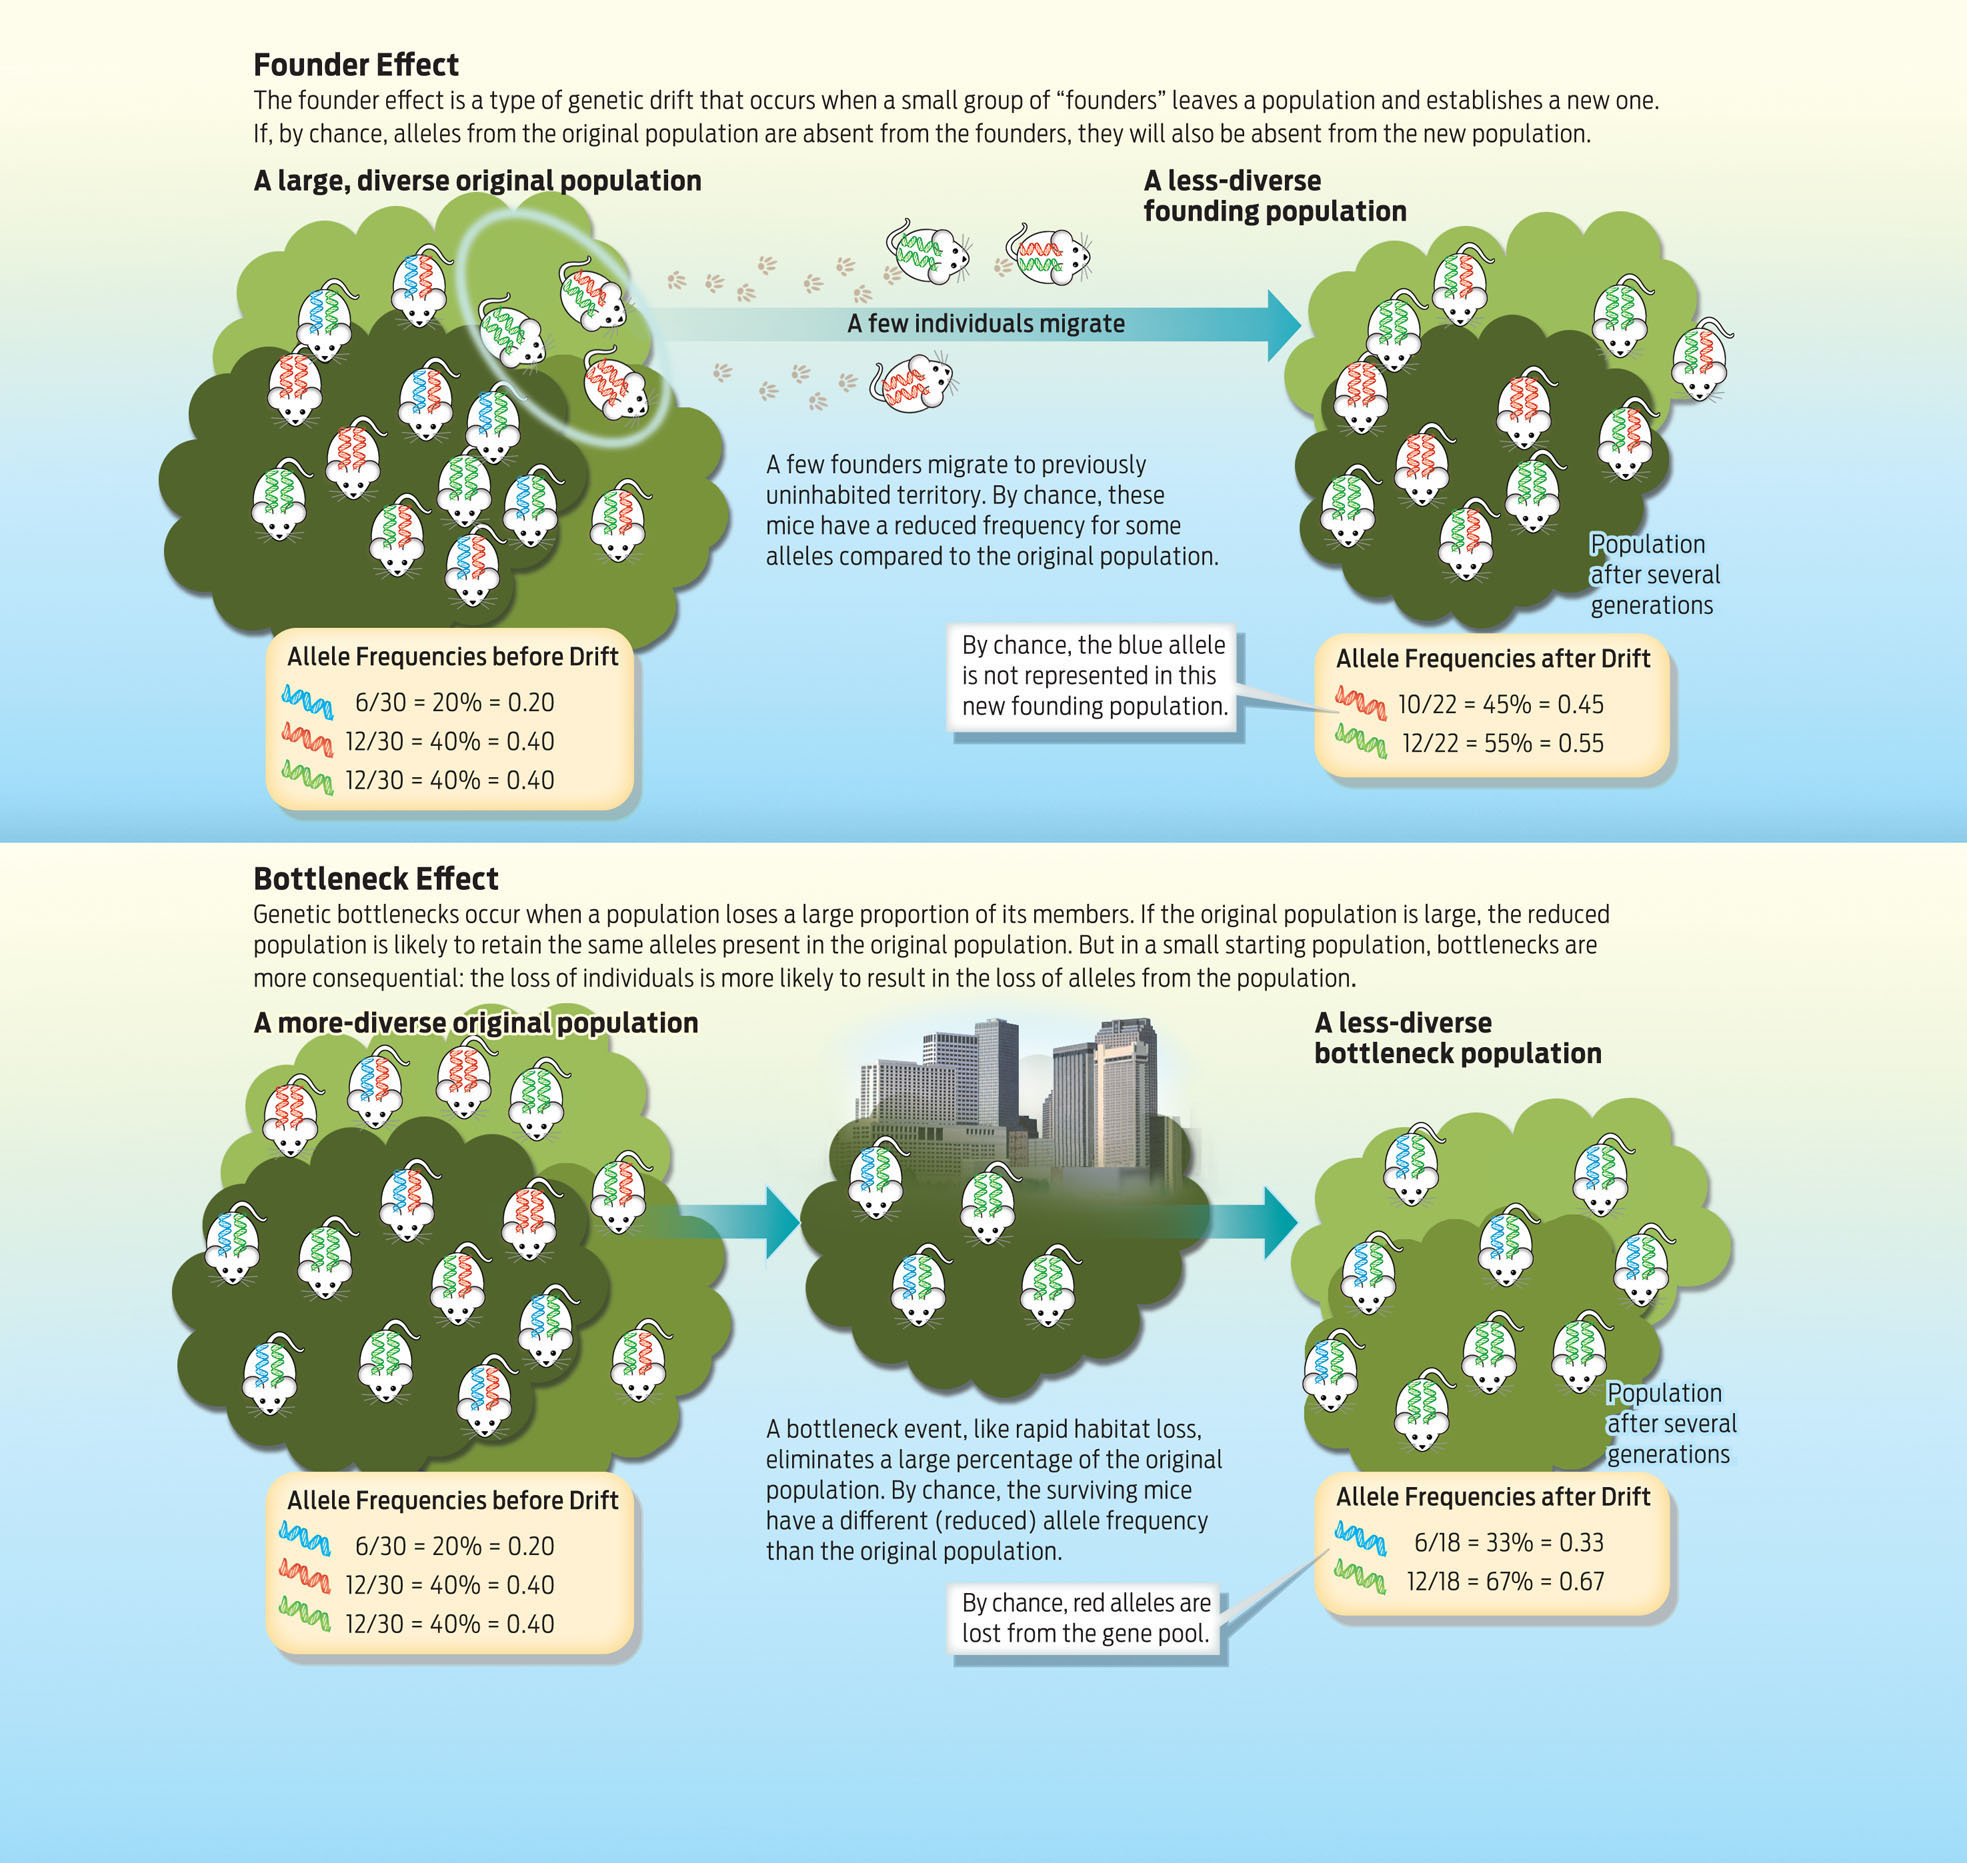
FOUNDER EFFECT A type of genetic drift in which a small number of individuals leaves one population and establishes a new population; by chance, the newly established population may have lower genetic diversity than the original population.
BOTTLENECK EFFECT A type of genetic drift that occurs when a population is suddenly reduced to a small number of individuals, and alleles are lost from the population as a result.
Biologists refer to two general types of genetic drift: founder effects and bottlenecks. A founder effect occurs when a small group of settlers (“founders”) splits off from a main population and establishes a new one. Because a founding population is by definition small, there is a good chance that the particular alleles it carries will not be fully representative of the population it left. Thus founder effects tend to reduce the genetic diversity of the new population.
Because white-footed mice are native to the New York region, it is unlikely that they have experienced founder effects; the populations that are here have all been here for a very long time.
More applicable to these mice is what’s known as a bottleneck. When a population is cut down sharply—forced through a “bottle-neck”—there’s a good chance that the remaining population will possess a less-diverse gene pool. Bottlenecks can occur from natural causes—say, a flood that sweeps through the city, killing many individuals—or from human interference, such as the cutting down of a forest. Either way, a population that is forced through a genetic bottleneck usually contains a fraction of the original starting diversity in the population (INFOGRAPHIC 15.3).
Allele frequencies can change from one generation to the next purely as a result of chance: this is genetic drift. Drift has more dramatic effects in smaller populations than in larger ones.
As an example of a genetic bottleneck, consider the cheetah (Acinonyx jubatus), the fastest land animal. Cheetahs almost became extinct 10,000 years ago when harsh conditions of the last ice age claimed the lives of many large vertebrates on several continents. Ultimately, a few cheetahs survived and reproduced, but the more than 12,000 individuals alive today are now so genetically similar that skin grafts between unrelated individuals do not cause immune rejection; nearly all genetic diversity has been eliminated from the population.
Why does genetic diversity matter? You can think of a gene pool as a population’s portfolio of financial assets. Having a diverse array of investments is a better strategy for long-term success than having all your money tied up in one kind of stock—especially if that stock loses value in changed economic times.
For example, say a population of mice suddenly finds itself in a more crowded and polluted environment than it did before. If the population carries with it a rich variety of alleles, then some of these alleles (ones associated with stronger immune systems, for example) may help that population survive and reproduce in the altered conditions. Individuals with these alleles will be more fit in this environment, and the population will adapt by natural selection. With less diversity in the population, the opportunity for adaptation will be more limited, and the population may shrink. Preserving genetic diversity is thus a prime concern of conservation biologists interested in protecting natural populations from extinction, especially as humans encroach on more and more wild habitat.