INFOGRAPHIC 30.5
TRENDS IN U.S. FOODBORNE ILLNESS SINCE 1996
3
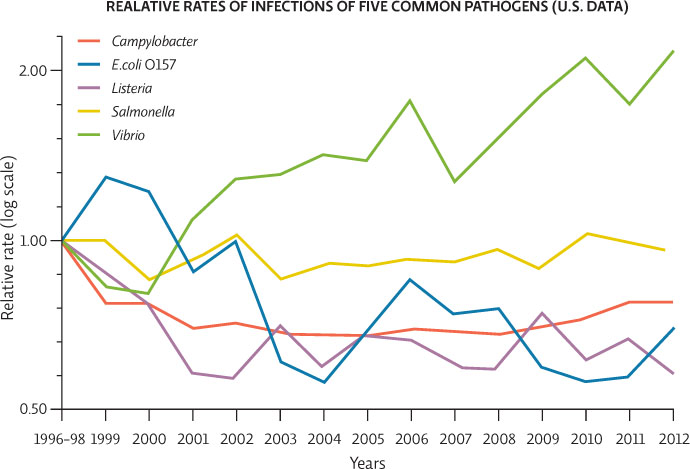
The CDC tracks foodborne illnesses in the United States. This graph shows data for five of the most common pathogens in laboratory-confirmed infections. The actual numbers of cases are not shown here, just how much the rate of incidence increased or decreased compared to the number of cases for each pathogen in the 1996–1998 time period. Since its high in 1999, E. coli O157 has declined (with ups and downs) but is still above the CDC 2020 target of no more than 0.6 cases per 100,000 people.