INFERENTIAL STATISTICS
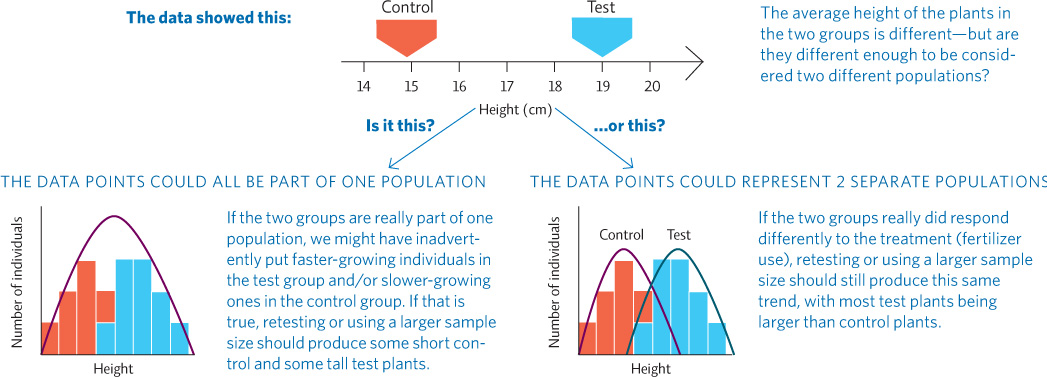
We can take our analysis further and evaluate the data with an inferential statistical test to determine how likely it is that the data we obtained from the two groups in our experiment actually represent different responses or whether our two groups are both just subsets of a single, larger group. The statistical test gives us a p-value—a number that tells us how much overlap there is between the data sets. In science, we generally require that there be no more than a 5% overlap between the two data sets. If the high end of one set (the control group here) overlaps just a little with the low end of the other data set (our test group), and this overlap is no more than 5%, we can conclude that the two groups most likely represent two distinct populations, a result of the treatment we applied—in this case, the addition of fertilizer. If the overlap had been more than 5% (a p-value > 0.05), we would not have sufficient evidence to conclude that they were indeed two different groups, but instead we would say they were likely to be a single group that varied widely.

For this data set, a t-test (a simple statistical test) yields a p-value of 0.035—our data sets overlap 3.5%. Therefore, we can conclude that the two groups are different at the 0.05 level. Because our experimental design eliminated other variables that might have affected growth (the only difference between the two groups was whether plants received fertilizer), it is reasonable to conclude that the greater growth was caused by the fertilizer. As you read about studies and evaluate the authors’ conclusions, look for the p-value given with the analysis of the data—if the calculated p-value is larger than 0.05, the author will probably conclude that there is not sufficient evidence to conclude that the variable tested had an effect.