SCIENCE LITERACY WORKING WITH DATA
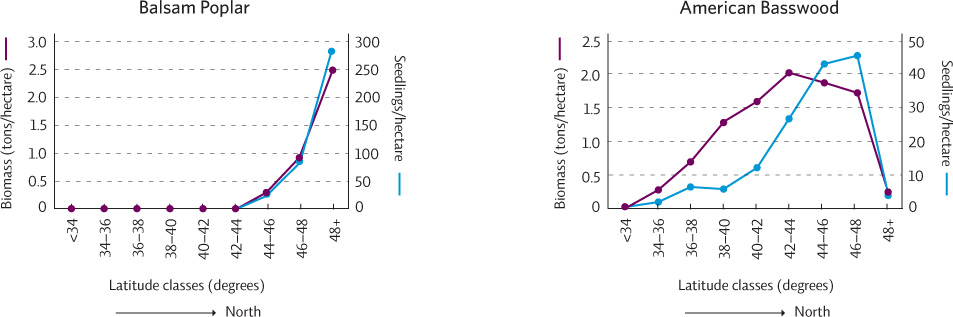
The following graphs show 2 of the 15 northern species evaluated in Chris Woodall’s study of tree-range migration mentioned in this chapter. The total standing biomass and the total number of seedlings of each species are shown at different latitudes within the study area.
Interpretation
1. What does the purple line on each graph represent? What does the blue line represent?
The purple line shows how many tons of standing biomass were found per hectare at each latitude class for the species shown in the graph. The blue line shows how many seedlings were found per hectare in the same latitude classes for that species.
2. There are 111 kilometers between two adjacent latitude lines. How far apart are the latitude classes shown here? How many kilometers wide is the study site (from latitude 34° to 48°)?
Each latitude class is 2 degrees wide so it represents 222 kilometers (111 x 2 = 222). The entire study area from 34° to 48° is 1,554 kilometers (48-34 = 14 degrees total; 111 x 14 = 1,554).
3. Look at each graph to determine at which latitude class each species shows the most biomass per hectare. Which tree species has more standing biomass at its peak: balsam poplar or American basswood? How can you tell?
Balsam poplar is more abundant. Though the data point falls at the same spot on both graphs, the y-axis is different. There are 2.5 tons/ha of balsam poplar at its peak latitude (48+) but only 2 tons/ha for America basswood at its peak latitude at 42-44 degrees.
Advance Your Thinking
4. Is either of these tree populations exhibiting a range migration shift? Present the evidence for your conclusions.
Balsam poplar does not appear to be migrating — there are not more seedlings either north or south of the adult population. American basswood on the other hand does appear to be shifting its range northward. There are few seedlings per hectare at lower latitudes, even though adult trees are present in increasing numbers. The latitude showing peak density for seedlings is actually higher than that for adult trees, suggesting more seedlings are surviving in the northern edge of their range though this drops off sharply above 48° for both seedlings and adults.
5. Of the two species shown here, which would you expect to see at higher altitudes on a mountainside and which at lower altitudes? Assuming that both species can migrate, what do you predict will happen to the populations of these two species if the climate warms a little? If it warms a lot? Explain your answers.
The balsam poplar appears to do better at higher latitudes so it would also probably do better at higher altitudes which tend to show similar climate gradations (cooler climates prevail as latitude and altitude increase). American basswood does not do well above latitude of 48° so it would likely have altitude limits but would be able to live at lower altitudes on the mountain. If the climate warms, a little, each population would be expected to migrate northward. If climate warms “a lot” however, balsam poplar might “run out of mountain” whereas the American basswood could continue to migrate upward for a longer period of time.