Evidence of global climate change abounds.
By all accounts, the forests of northern Minnesota are places of uncommon majesty. Moose and deer meander through an ocean of trees—some of them close to 1,000 years old—that grow out of colossal, hundreds-of-feet-high granite hills whose outcrops reflect the colors of day: pale, soft pink when the Sun rises and deep, somber rouge when it sets. The serenity belies an unsettling truth: This forest, which has existed for more than 3,000 years—since the early days of the Roman Empire—and even inspired the Wilderness Act of 1964, could vanish within the next century.
To Frelich’s well-trained eye, the signs are obvious. He has spent his entire adult life trekking through this ancient landscape, observing it and cataloguing the changes—inch by inch, leaf by leaf. So it’s no surprise that when he looks on the placid landscape, he sees a catastrophe unfolding. In one patch of forest, scrawny young birch trees bud several weeks ahead of schedule. In another, adult birches are dying off rapidly, leaving a graveyard of bony white trunks. “A long growing season is not good for this tree,” Frelich explained, “because it goes hand in hand with warmer soil, which the paper birch doesn’t tolerate well.” Meanwhile, red maple, a temperate species that grows as far south as Louisiana but is far less common up north, is thriving in northeast Minnesota’s Sea Gull Lake area. “When you have red maples growing as much as 4 feet in a single year,” said Frelich, “you are not talking about a boreal climate anymore.”
Regional climate data correlates well with the changes Frelich sees. In the past two decades, springtime has come ever earlier to the region—a week or two sooner than the historical average, according to the climatology office of the Minnesota Department of Natural Resources. Nine of the state’s 20 warmest years have been recorded since 1981. And for the first time in recorded history, Minnesota logged three mild winters in a row, each with record highs: 1997, 1998, and 1999.
Those data correspond to larger global trends. Each of the past three decades has been warmer than any decade since the late 1800s, when reliable temperature measurements began. Overall, 2000 to 2010 is the warmest decade on record since climatologists started keeping records back in 1850. The 10 warmest years have all occurred since 1998, with 2005 and 2010 tying for warmest individual year. The global land average temperature increased by 0.85°C (1.53°F) from 1880 to 2012, with most of that warming occurring since 1950.
KEY CONCEPT 21.1
Weather refers to the day-to-day conditions outside your window; climate describes the long-term weather patterns expected in a given area.
A degree or two might not seem like much. But even such seemingly small changes in climate can have tremendous impacts on weather and, thus, on natural ecosystems and human societies. INFOGRAPHIC 21.1
A shift of only a few degrees in the average global temperature will likely result in more frequent and extreme heat waves. Compared to the mid-20th-century average, we have increased about 1.7°F (~1.0°C). To put this in perspective, at the end of the last ice age 10,000 years ago, Earth’s average temperature was only about 5.5°F (3.0°C) colder. At that time there was an ice sheet 1.6 kilometers (1 mile) thick as far south in North America as Chicago.
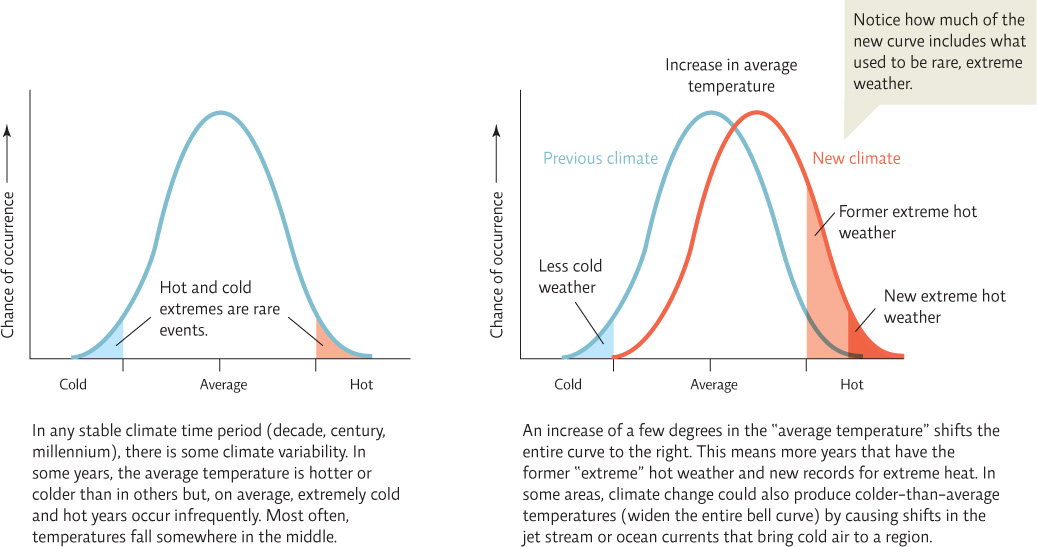

Climate change could also produce a new temperature curve that is broader and flatter. What would this mean for cold and hot temperature extremes?
This means one should expect to see more extreme hot and cold weather events as well as hotter extreme hot events and colder extreme cold events.
In fact, we are already seeing some big effects, especially in the Arctic, which is particularly vulnerable to climate change because warming that occurs there causes ice to melt, which triggers additional warming. Warming in the Arctic is also affecting weather around the world. Recent studies suggest that climate change is altering the Northern Hemisphere’s polar jet stream, slowing it down and making it “wavier,” meaning the peaks and troughs of the jet stream are extending farther north and south as the jet stream moves from west to east. This brings colder-than-normal air farther south and can slow down the movement of weather systems, sometimes causing them to stall and dump excessive amounts of snow or rain in one area. Essentially, cold arctic air is reaching farther south than normal, more often than normal, and for longer periods of time, contributing to extreme winter weather events such as those seen in North America and Europe in recent years.
So how quickly is the Arctic warming? In 2011, researchers at Cambridge University evaluated the weather patterns of Ellesmere Island, Nunavut, in Canada’s Arctic, and found that spring and summer temperatures were 11° to 16°C (20° to 29°F) higher than in previous years—making the climate similar to a boreal climate 1,600 to 2,200 kilometers (1,000 to 1,400 miles) farther south. But as large as that increase was, it was not entirely surprising.
In 2007 and some subsequent years, researchers have measured record losses of sea ice (ice that floats on top of the ocean) in the region, including the record low sea ice extent that occurred in September 2012. Based on the current rate of melting, the entire Arctic could be completely ice free in the summers come 2035.
And it’s not just arctic ice that’s melting. Overall, sea ice is decreasing about 3% to 4% per decade. In Antarctica, the Larsen B Ice Shelf—a colossal sheet of sea ice, more than 210 meters (700 feet) thick and as big as Rhode Island—collapsed in 2002 in just a couple weeks. This stunning spectacle, which took climatologists by surprise, was repeated in 2008, when the Wilkins Ice Shelf (also in Antarctica) collapsed, again in the space of 2 weeks.
KEY CONCEPT 21.2
A change of just a few degrees in average temperature can result in a climate with a larger number of extreme weather events than normal and new record temperatures.
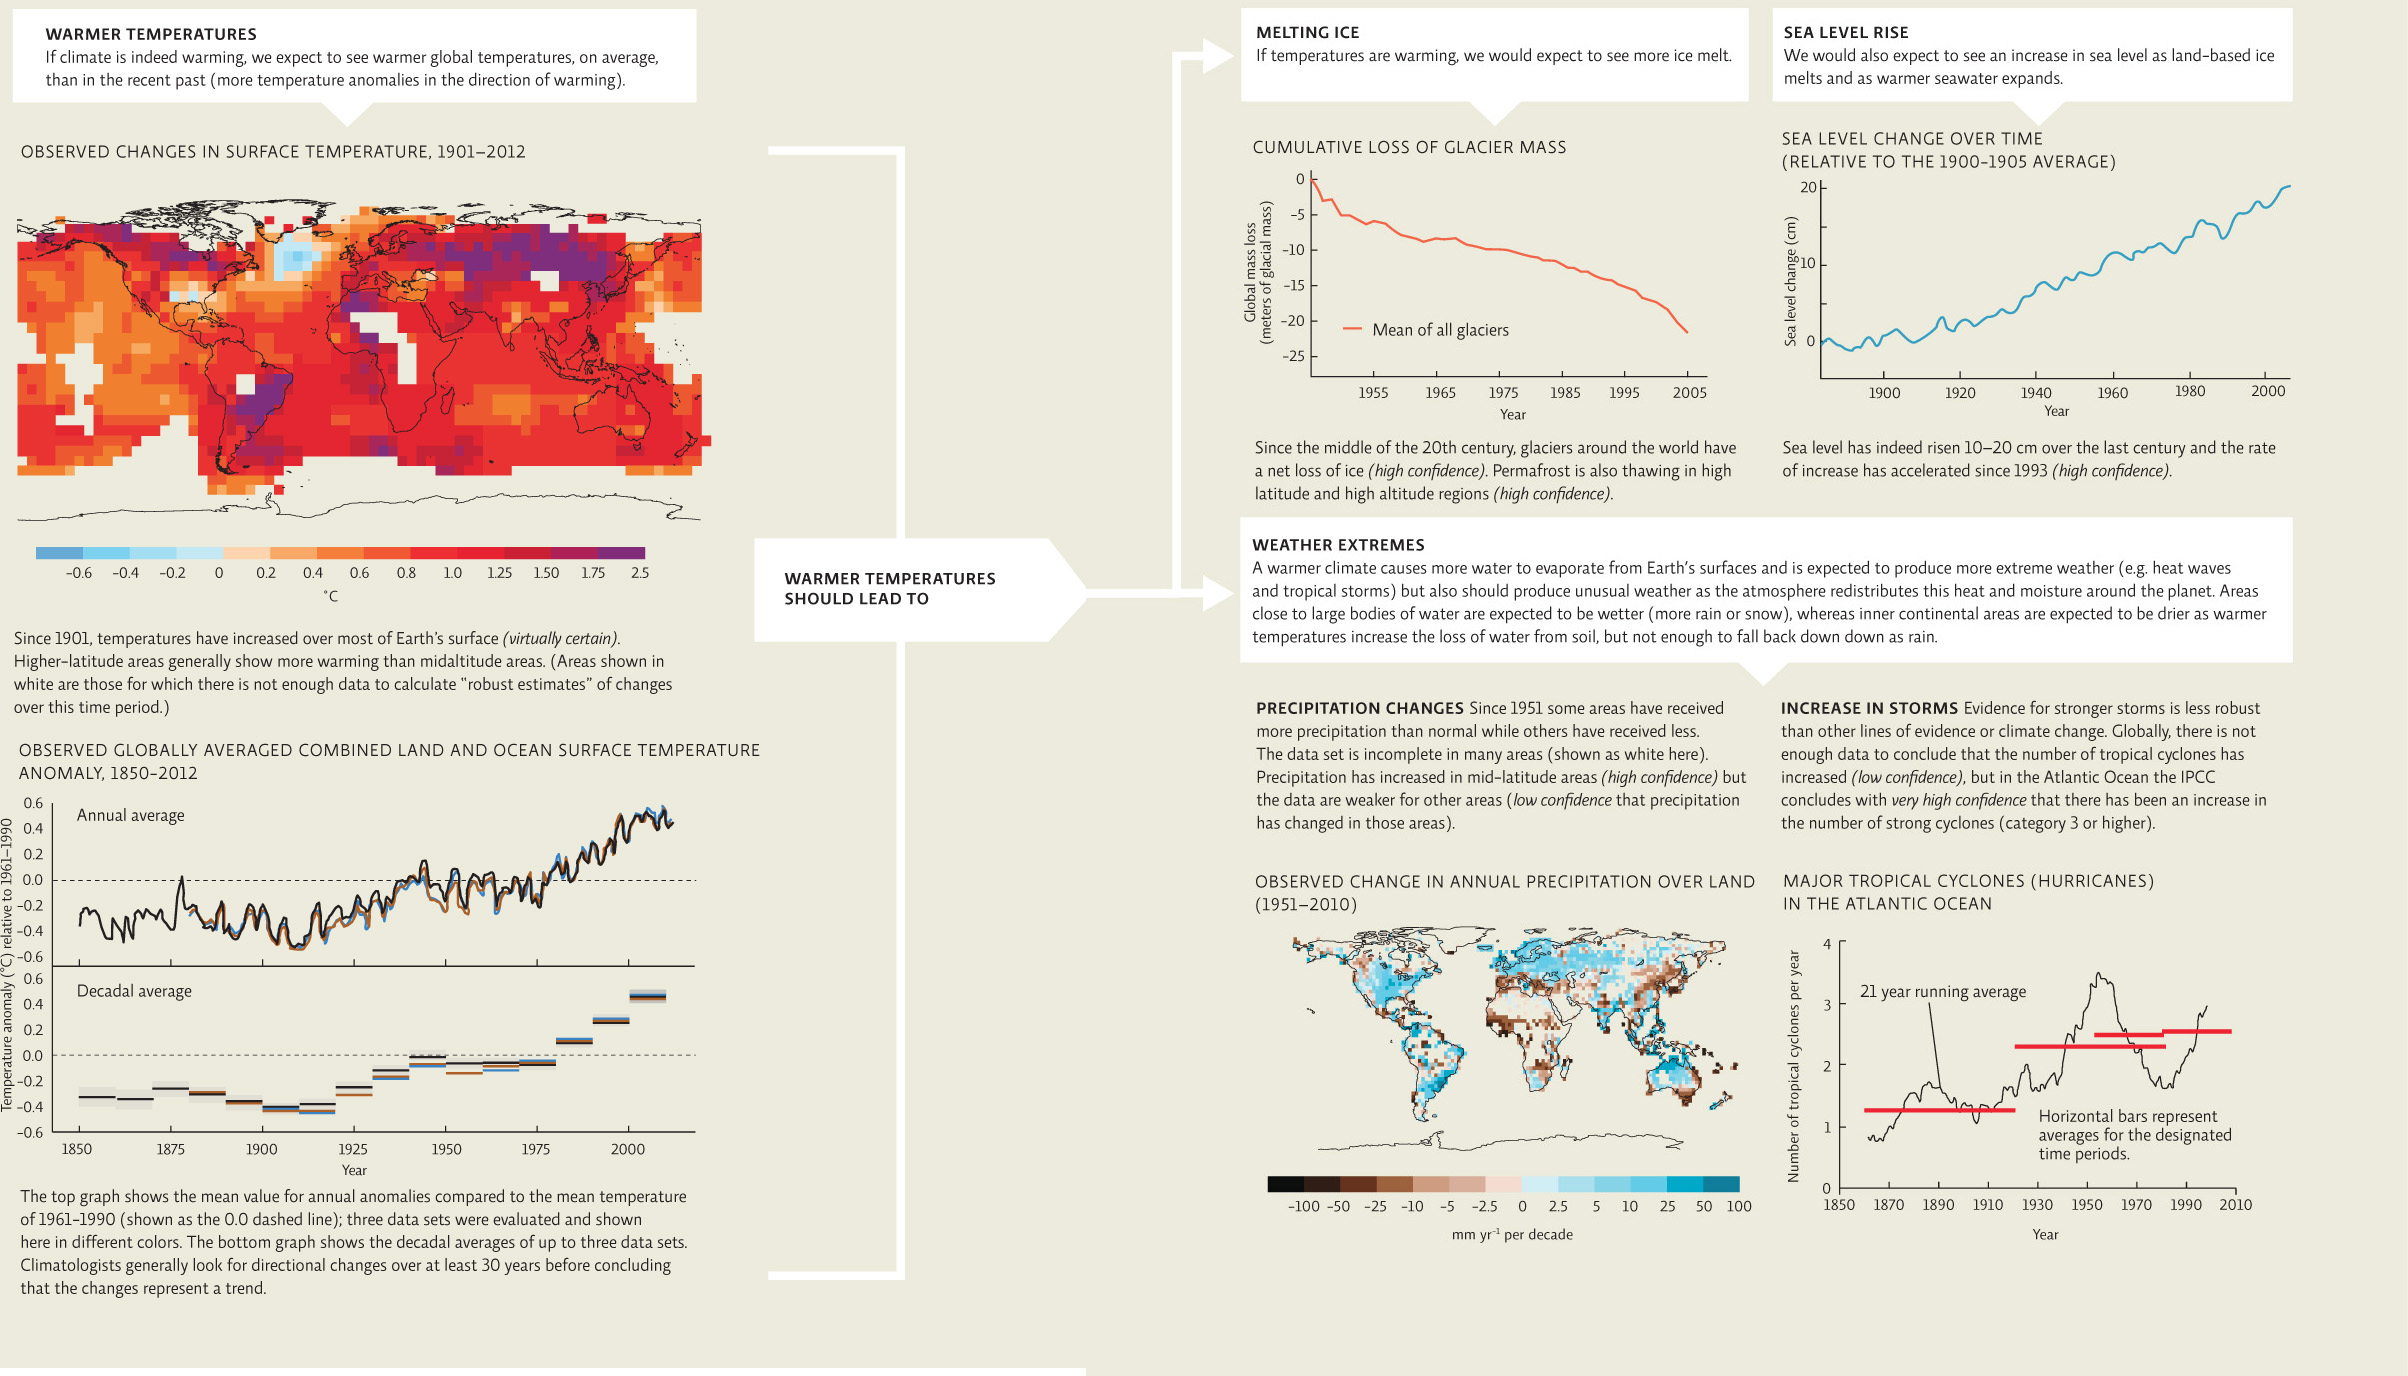
Land-based ice (glaciers) in high-altitude and high-latitude areas is also melting at unprecedented rates. And as ice on land melts, sea levels are rising—by an average of 10 to 20 centimeters (4 to 8 inches) during the 20th century. About half of this rise was due to land-based ice melt and the other half to thermal expansion— the expansion of water molecules as they heat up. Rising sea levels have already displaced hundreds of thousands of coastal-dwelling people around the world. A 2014 NASA report concluded that glaciers in West Antarctica are melting faster than previously realized and appear to have passed a “point of no return” in which complete glacial melt may be unstoppable. Total melting of these glaciers would raise sea level by as much as 1.2 meters (4 feet) over the next few centuries.
KEY CONCEPT 21.3
A warming planet should see warmer average temperatures, melting land and sea ice, rising sea levels, and precipitation changes; all of these are currently being observed.
When evaluating the evidence for climate change (e.g., its occurrence, its causes, its effects), it is important to do so scientifically and place a level of certainty on conclusions. The United Nations (UN) and the World Meteorological Organization established the Intergovernmental Panel on Climate Change (IPCC) to do just this in 1988. The IPCC is made up of thousands of scientists from around the world. They evaluate all the climate science that is published through peer review and compile it into a cohesive series of publications that explain what is understood about the current state of the climate; they also make recommendations that may inform government action. The IPCC recognizes five levels of confidence that its conclusions are correct: very low, low, medium, high, and very high. INFOGRAPHIC 21.2
We know that a variety of factors can alter global temperature, but what is the physical evidence that temperatures have actually increased and that the climate is changing? In other words, what do we predict we would see if warming were occurring, and what do we actually see when we test those predictions?
Why is it important to look at multiple lines of evidence that climate is changing rather than just evaluate global temperatures?
Multiple lines of evidence that all point to the same conclusion strengthen the conclusion that climate is indeed changing. Simply monitoring temperature would only tell us whether temperatures are changing, not whether this was actually affecting other aspects of climate (i.e. precipitation and storms) or ecosystems (i.e. ice melt and sea level rise).
Intergovernmental Panel on Climate Change (IPCC)
An international group of scientists that evaluates scientific studies related to climate change to thoroughly and objectively assess the data.