SCIENCE LITERACY WORKING WITH DATA
A regional power company has proposed building a wind farm in your community. There is plenty of wind, so many people in the community think this is a good idea. Some, however, have cited the environmental impacts of windmills, especially bird and bat mortality. Examine the following graphs and use them to answer the questions that follow.
Interpretation
1. In one or two sentences, summarize the information provided in each graph or table.
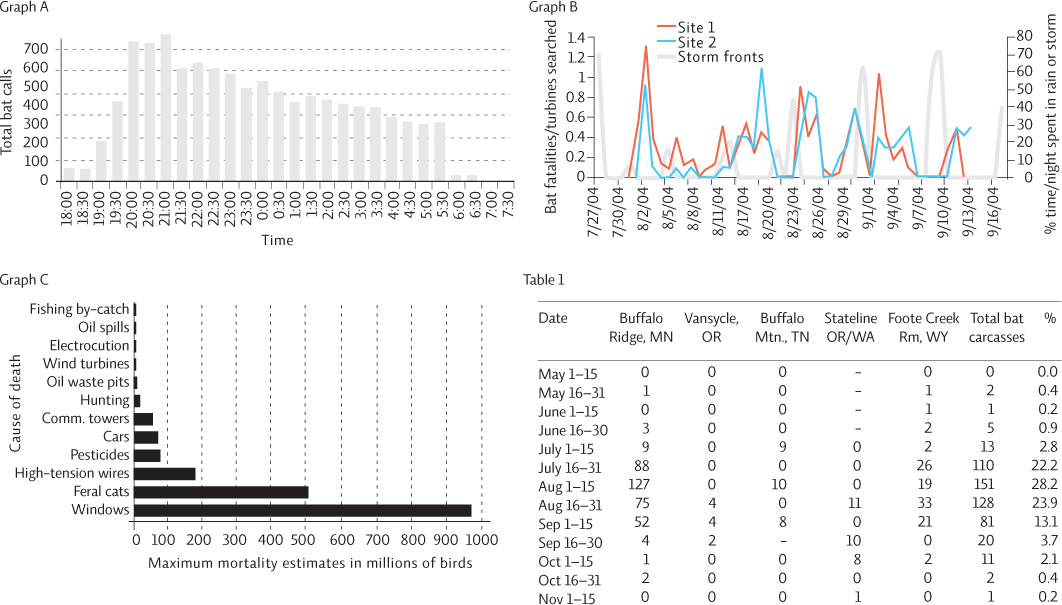
Graph A: Information about numbers of bats calls heard at intervals throughout the night, starting at 6 PM (18:00), as a measure of bat presence.
Graph B: Provides information about bat mortality as a function of the number of turbines searched at two different sites (both in the same general area) on different days. Storm front data is plotted on the same graph to determine if there is a relationship between weather and turbine mortality.
Graph C: Figure 1. Information about bird mortality associated with a variety of causes.
Table 1: Provides bat mortality at different sites across the United States biweekly between May and November.
2. For each graph or table, provide a title and a summary of the results.
Graph A:
Title: Nightly Activity Patterns of Bats
Summary: Numbers of bats were counted every 30 minutes from 6 pm to 7:30 am. Counts were highest from 8:30 pm to 10 pm, but hundreds of bats were counted every half hour during the night. After 6:30 am, bat counts dropped, and no bats were observed after that.
Graph B:
Title: Bat mortality, in relation to storm fronts, at two wind farms during the summer of 2004.
Summary: Bat mortality as a function of number of wind turbines searched every 3 days beginning at the end of July 2004 and continuing through the middle of September 2004. The % of the time that it was raining during the period is also graphed. On some nights, mortality and rainfall both were high. However, on other nights, mortality was high in the absence of rainfall. Based on these data, it is difficult to conclude that rainfall impacts, either positively or negatively, wind turbine associated bat mortality.
Graph C:
Title: Human related causes of Bird Mortality
Summary: Annual bird mortality, in millions, for a variety of human causes. The most common cause of death for birds is windows. Compared to all other human related causes, wind turbines kill relatively few birds.
Table 1:
Title: Bat mortality during two-week intervals at wind farms located around the US.
Summary: Bat mortality was counted at 5 different wind farms across the country in two-week intervals beginning in May and ending in November. Mortality was highest during the first two weeks of August across all sites. Between sites, mortality was highest at the Minnesota site, followed by the Wyoming site.
Advance Your Thinking
3. Based on the data and where you live, what do you think the impact of a wind farm in your area would be on bird and bat mortality? If a wind farm were installed, what recommendations could you make to reduce bird and bat mortality? Make sure to discuss your answer in relation to each of the graphs/tables.
Answers will vary. Birds: For students living in cities with large buildings, windmills will be a small threat compared to windows. The same is true for suburban areas with lots of cats. In remote areas, windmills may pose more of a proportional threat to birds and any places that are near migration routes or areas with high concentrations of predatory birds, such as the cliffs that support eagles in California, might not be good sites.
Bats: Storm activity does not seem to be related to bat mortality so the climate of the area may not be a matter for consideration. Bat mortality could be reduced if windmills were turned off at night but this is usually when the most wind blows. Avoiding putting windmills near known bat roosting sites (caves, etc.) would be helpful.