Policies sometimes have unintended consequences.
The numbers on the computer screen in Wara’s Stanford office are digital avatars; their real-life counterparts— invisible gaseous molecules that trap heat and thus warm our atmosphere—exist a world away. They can be found in the large, fluffy plumes of smoke that curl up from the pipes of aged coolant factories in regions like the state of Gujarat in western India, then billow and disperse across low-slung, densely packed metropolises. Those factories produce two gases in particular: HFC-22, used in refrigeration and air conditioning; and HFC-23, which is merely a by-product of creating HFC-22. Because both gases are potent global warmers, both are regulated under the Kyoto Protocol.
There are six Kyoto gases in all: carbon dioxide (CO2), methane, nitrous oxide, hydrofluorocarbons (HFCs), perfluorocarbons (PFCs), and sulfur hexafluoride. For the purposes of crediting, each is converted to its equivalent in carbon dioxide, widely agreed to be the most abundant and most massively emitted of the six. So carbon dioxide is assigned a value of 1 (meaning that a single credit represents permission to emit 1 metric ton of CO2 per year), and the remaining five are valued in relation to that, based on how potent they are as warmers and how long they can be expected to remain in the atmosphere. Methane is valued at 25 (1 ton of it equals 25 tons of CO2, and thus 21 carbon credits), nitrous oxide at 298, and so on.
To be sure, the Kyoto Protocol has achieved some successes. The United Kingdom, for example, met its 2012 Kyoto target—a 12.5% reduction in greenhouse gas emissions relative to the 1990 baseline—in 2000, more than a decade early. By the actual deadline, it had cut emissions by a whopping 23%—or double its Kyoto target. Germany also exceeded its Kyoto targets by nearly 10% by the 2012 deadline.
The United States also took steps to monitor and reduce emissions as part of its UNFCCC commitment. Though U.S. greenhouse gas emissions are still higher than 1990 levels, thanks to energy-efficiency improvements and land-use changes (like reforestation projects), they are starting to fall—dropping 10% between 2005 and 2012. Improving fuel efficiency in vehicles is also part of the U.S. approach. New targets for corporate average fuel efficiency (CAFE) standards of vehicles have been set; the 2011 average for cars and light trucks of 27.3 miles per gallon (MPG) will incrementally increase to 54.5 MPG by 2025. INFOGRAPHIC 24.7
corporate average fuel efficiency (CAFE) standards
A target of the minimum fuel efficiency (MPG) that manufacturers must meet; evaluated as a weighted average of all the cars and light trucks each manufacturer produces.
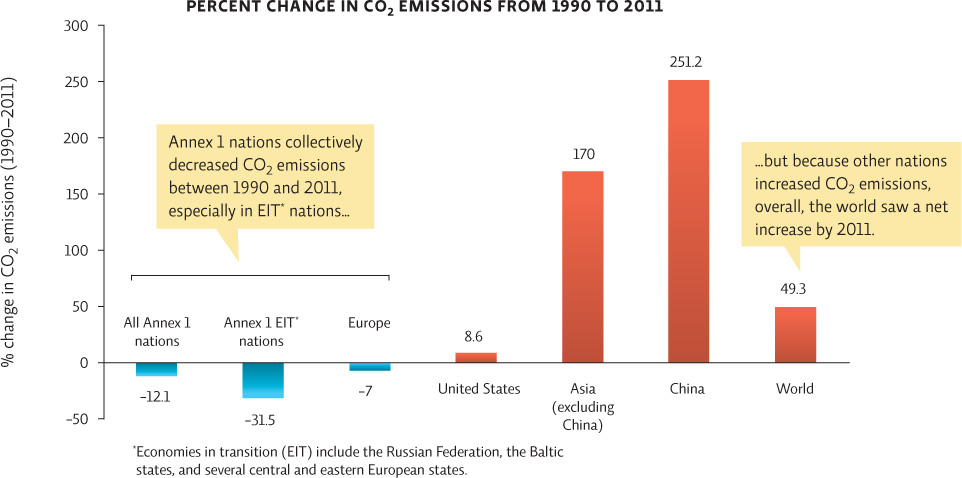
The International Energy Agency tracks CO2 emissions from fossil fuel combustion, the leading contributor of greenhouse gas emissions. Data comparing 2011 emissions to the baseline year of 1990 are shown here. While some nations did have a significant drop in CO2 emissions, others actually increased their emissions. Overall, the Annex 1 nations of the Kyoto Protocol (developed nations that committed to emission targets) reduced emissions and exceeded their Kyoto target of a 4.7% reduction by 7.4%. Much of this reduction was due to the economic restructuring of many of the countries of the former Soviet Union and Eastern bloc. The United States, which did not ratify the protocol and was not bound by its target of a 7% reduction, actually increased CO2 emissions by 8.6%. Developing nations were not given any reduction targets and many had an increase in emissions. Overall, compared to 1990 emission levels, the world saw a net increase of 49.3%.


This graph shows the percentage change in CO2 emissions between 1990 and 2011. Why might it also be helpful to see the actual CO2 emissions of each group to determine the contribution of each to the problem and solution?
KEY CONCEPT 24.8
Despite efforts to reduce CO2 emissions, and successes in some countries, worldwide emissions continue to increase.
Knowing the actual CO2 emissions gives us a feeling for the contribution each is making to the problem and a frame of reference for understanding how impactful increases or decreases might be. For instance, if Annex 1 EIT nations produce very little CO2 emissions, then a 31.5% decrease will not impact overall emissions that much. Along the same lines, if China released very little CO2 in 1990, then a 251.2% increase is not that much but if they released a lot of CO2 in 1990, then their increase represents a substantial increase in emissions overall.
The coolant factories, though, stand in stark contrast to these achievements, in large part because of the way gases were assigned value under Kyoto. HFC-23, which is a potent greenhouse gas and has an atmospheric lifetime of 270 years, has been valued at 11,700. This means eliminating just 1 metric ton of this by-product gas earns a company 11,700 carbon credits. And that means the gas—a mere by-product with no commercial value of its own—is very valuable. When approved as a CDM project, industries in developing countries earn carbon credits by destroying these gases; they then sell these credits to Annex 1 parties that are themselves trying to meet Kyoto targets. According to Wara’s calculations, in some years—when carbon credits were selling for a lot and coolant was selling for just a little—the companies made more than twice as much from the credits as they did from the coolant itself. “That’s a profound distortion of the market,” he says. “Once that balance shifts, you’re not in the coolant business anymore, you’re in the carbon business.”
KEY CONCEPT 24.9
Once policies are implemented, flaws may emerge or conditions may change, but adaptive management can inform policy changes that address these issues.
At least some factories resorted to dubious measures to maintain that business: Data from Wara and others revealed that during crediting periods, they would deliberately use less efficient manufacturing processes in order to generate as much HFC-23 as possible, so that they could maximize their profits by destroying the gas. They also overproduced HFC-22 “above levels that otherwise would be produced in response to HFC-22 market demand,” according to a report by the NRDC, “simply in order to maximize HFC-23 for destruction.”
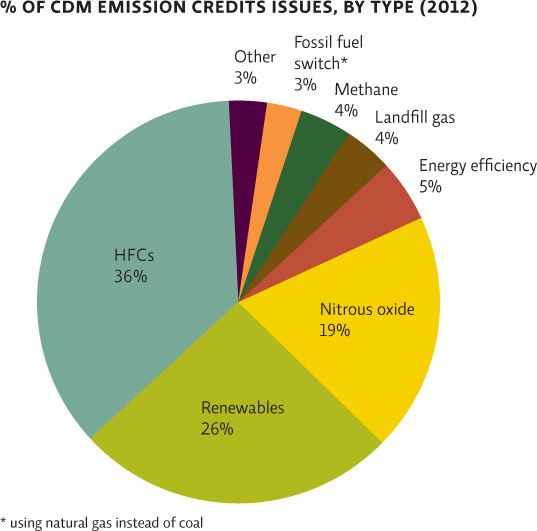
“It’s just such a far cry from what policy makers envisioned happening when they set this whole thing up,” says Andersen. “The idea was that the money paid for the credits would fund renewable energy projects in the developing world—things like solar and wind power.” Instead, the vast majority of that money— billions of dollars—has been given to the refrigeration industry. The CDM reports that since the UN program began, more than 40% of all credits have been given to just 19 HFC-22-producing coolant factories—the majority of them in China and India. Countries in Sub-Saharan Africa, which were initially expected to be big beneficiaries of the CDM program, have been left out in the cold. INFOGRAPHIC 24.8
The main intention of the Clean Development Mechanism was to fund low-carbon energy production facilities in developing nations in order to reduce global greenhouse gas emissions. Because it is cheaper to build a new power plant from scratch in a developing country (that would be building one anyway) than to prematurely close down or retrofit an older polluting power plant in a developed country, this was seen as a way to reduce global carbon emissions in a more cost effective way. Early on, however, almost half of CDM money went to HFC projects. Other projects are beginning to catch up with non-HFC projects making up around 64% of the total in 2012.


What could be done to get the CDM system back on track to achieve its main goal of funding low-carbon energy production facilities in developing nations?
One approach would be to limit the number of permits sold for projects like HFCs that are gaming the system. Alternatively, better oversight might be able to uncover and remove players that are abusing the system.
“Once that balance shifts, you’re not in the coolant business anymore, you’re in the carbon business.”
—Michael Wara