SCIENCE LITERACY WORKING WITH DATA
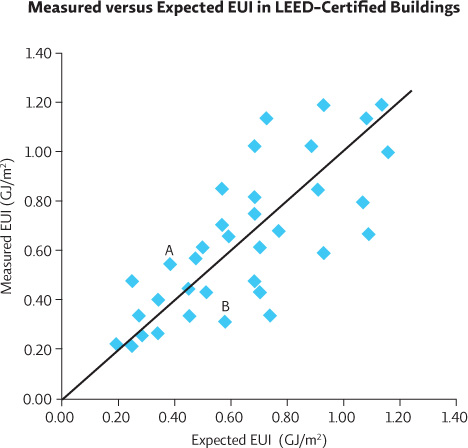
One common measurement of how well a building performs with regard to energy usage is its energy use intensity (EUI). EUI is expressed as energy used (in gigajoules) relative to a building’s size so that structures of different sizes can be compared. This graph plots data for 36 LEED-certified office buildings, comparing their actual performances to expected performances, based on their designs. (Each data point represents a different building’s EUI.) The line shown is not a trend line for the actual data; it is a line that bisects the graph at a 45-degree angle. This line allows us to see how closely the expected values match the observed values.
Interpretation
1. Look at the points labeled A and B. For each, what was the expected EUI predicted by the design plan? What was the actual measured EUI for this building?
Predicted: A=0.39 GJ/m2; B=0.58 GJ/m2 ; Actual: A=0.55 GJ/m2; B=0.32 GJ/m2
2. Which of these two buildings, A or B, is performing better than expected?
Building B performed better than expected; its actual measured EUI was lower than what was expected based on its design
3. Give the coordinate points for the one building that performed exactly as expected.
0.45, 0.45; this is the point that is on the black line
4. What does the line in the scatter plot tell you about those buildings above or below it?
Buildings whose data points are below the line underperform relative to expectations, and those above it outperform expectations
Advance Your Thinking
5. About how well do LEED-certified buildings meet or exceed their predicted EUI?
About half of them meet or exceed their predicted EUI, meaning that about half do not. But, in most cases where they performed better or worse than expected, they were still close to the expected levels.
6. The average EUI for non-LEED-certified office buildings is 2.19 GJ/m2. How do LEED-certified buildings, even those that do not perform as well as expected, compare to this average?
Even though about half of the buildings do not perform as well as expected, all 36 perform better than the average non-LEED building and in most cases they perform much better; 33 out of 36 LEED buildings had EUI values less than half of the average non-LEED building (1.095 GJ/m2).