SCIENCE LITERACY WORKING WITH DATA
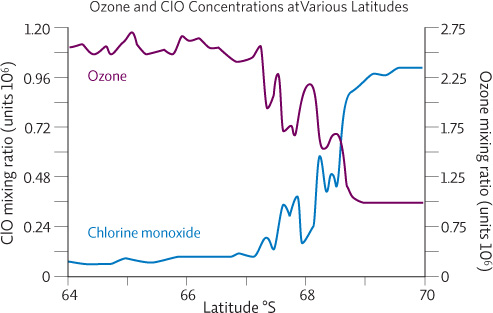
The graph below comes from a study exploring the correlation between chlorine monoxide (ClO) and ozone. The data were collected by placing the measurement instrument on the wing of a plane and flying through the Antarctic ozone hole.
Interpretation
1. What does this graph show? Describe the pattern that you see.
The graph shows the levels of chlorine monoxide and ozone between 64 and 70 degree south latitudes. The general pattern is when chlorine monoxide levels are high, ozone levels are low, and vice versa.
2. Looking at the levels of ozone relative to the levels of chlorine monoxide, which side of the graph do you think most likely represents the inside of the ozone hole? On what basis do you think this?
The ozone hole is on the right side of the graph. Since we know ozone depletion is caused by chlorine (from CFCs), and that these chlorine molecules react with ozone to produce chlorine monoxide, ozone levels would be expected to be low on the inside of the hole, where chlorine monoxide levels are high. On the outside of the hole (left side of graph), the reverse is true: ozone levels are high and chlorine monoxide levels are low.
3. Compare this graph to the graph in Infographic 2.2 (on ozone depletion and CFC levels). Although both graphs show a similar pattern, they are about two different aspects of the CFC–ozone story. Compare and contrast the information presented in the two graphs.
The graph in Infographic 2.2 shows the changing levels of ozone and CFC-12 from 1960 to 2010—a pattern over time. On the other hand, the graph above shows the levels of chlorine monoxide and ozone between 64 and 70 degree south latitudes—a pattern over a location. Data from both graphs supports the hypothesis that chlorine, especially from CFCs, causes ozone depletion in the stratosphere. The graph in Infographic 2.2 provides evidence that increased ozone loss occurs when CFCs (the source of the chlorine) are present, and as CFCs begin to level off ozone begins to recover. In addition, the graph above provides evidence that ozone levels are low where chlorine monoxide (the product of chlorine reacting with and destroying ozone) levels are high inside the ozone hole.
Advance Your Thinking
4. Do the data in this graph show a correlation or a cause-and-effect relationship? Do they support the hypothesis that chlorine is the cause of ozone depletion? Explain your responses.
The data in this graph shows a correlation—high levels of chlorine monoxide occur with low levels of ozone and vice versa. Generally correlational data does not establish cause and effect. We cannot know if chlorine monoxide is the cause or effect of ozone depletion, or whether the two trends occur together by coincidence. Even so, this data does support the hypothesis that chlorine is the cause of ozone depletion. Based on ozone-depletion models, researchers like Solomon hypothesized that when CFCs break down in the stratosphere they produce chlorine. This free chlorine destroys ozone and generates chlorine monoxide. So if this hypothesis was correct, and such reactions were occurring, ozone levels should be low where chlorine monoxide levels are high and vice versa—which is exactly what this study found in gathering data on ozone and chlorine monoxide concentrations inside and outside the ozone hole.
5. How are these data similar to and/or different from the data collected by Susan Solomon’s team? What do these data mean for the hypothesis that Solomon proposed?
Solomon’s team raised balloons into the air to measure the composition of the atmosphere where the ozone hole was found. Their measurements showed that at the time of year when ozone was dropping, the Antarctic stratosphere contained high levels of ClO. The data reported in this graph was collected by placing the measurement instrument on the wing of a plane and flying through the Antarctic ozone hole. This data too shows that ozone levels are low where chlorine monoxide levels are high inside the ozone hole, while the reverse is true outside the hole.
Both data sets are similar in showing that there is a strong link between the presence of chlorine monoxide and the loss of ozone. They are different in how the data was collected (balloons versus a plane). As a result, both data sets provide evidence to support Solomon’s hypothesis that UV-driven reactions in the stratosphere free chlorine from CFCs, and that these isolated chlorine atoms destroy ozone and produce chlorine monoxide. These multiple lines of evidence increase confidence in the hypothesis that CFCs are responsible for ozone depletion.
6. How does this research study support the idea that science is a community enterprise?
By itself, this data about the levels of chlorine monoxide and ozone would not be sufficient to support the hypothesis that CFCs are responsible for ozone depletion. However, it contributes to the accumulated knowledge of the scientific community on the connection between CFCs and ozone, and provides another line of evidence to support the hypothesis. Understanding the causes and consequences of the depletion of the ozone layer is the work of many scientists, individually testing and fine-tuning the hypothesis, and collectively contributing to build a more complete understanding of the phenomenon than if any of them worked alone.